Chapter 1. Where in the Shopping Journey Do AI Engines Show Products? The Nine Intent Stages on Four Engines
Chapter 1 of the AI Shopping Visibility Study 2026. For each of nine shopping intents, from problem recognition to post purchase: how often ChatGPT, Google AI Mode, Copilot and Perplexity show product cards, which brands and merchants fill them, who gets cited, and how the answer is shaped. 16 figur

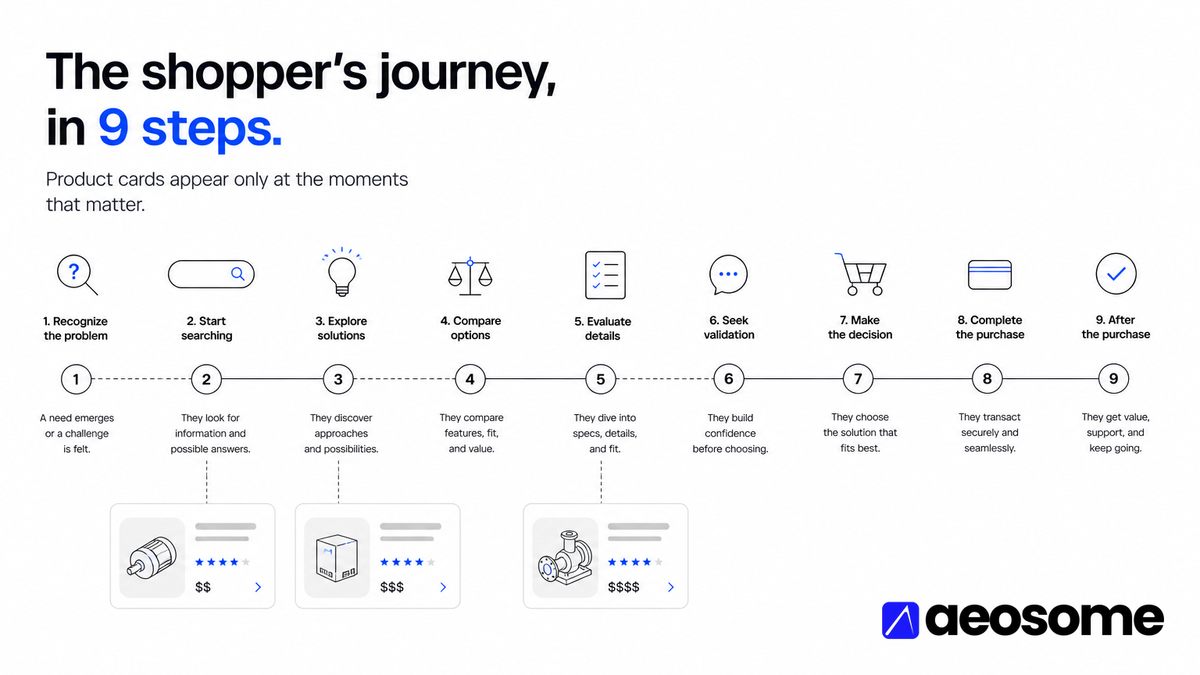
AEOsome Research. Vijaya Kumar Channalli. Chapter 1 of the AI Shopping Visibility Study 2026, version 2026-10. The hub page carries the abstract, the ten findings, the methods summary, and the other six chapters. This chapter walks the nine shopping intents one by one.
Abstract
Every question in both studies was tagged with one of nine shopping intents: Problem Recognition, Category Exploration, Budget Framing, Attribute Constrained, Comparison, Validation / Risk Reduction, Scenario Confirmation, Purchase Execution, and Post Purchase. This chapter reports, for each stage and each engine, how often a product card appears, how many products and brands it holds, who hosts the cards, which pages are cited, what the answer text looks like, and the price, rating, and review profile of what is shown. Study 1 covers 8,520 ChatGPT answers about women's dresses (February 2026); Study 2 covers 22,335 de-duplicated answers across ChatGPT, Google AI Mode, Microsoft Copilot, and Perplexity in seven categories (May 2026).
Three results organize the chapter. First, the stage order agrees across engines at the extremes: Budget Framing is first or second on every engine (Study 2 pooled 54.8%), Post Purchase is last on every engine (14.7%). Second, the middle of the funnel is engine-specific: comparison and validation questions get cards on 67% and 54% of Google AI Mode answers but on 15% and 8% of Study 1's ChatGPT answers. Third, the stage changes not only whether cards appear but what they contain and what is cited: shelves are widest at exploration, narrowest at comparison; citations are editorial at the top of the funnel, retail at purchase, and community-based at comparison and validation, where Reddit appears in up to 79% of answers.
1. Scope and Reading Guide
Definitions, de-duplication, extraction, and confidence labels are in the hub's methods section and in chapter 7. In short: a product card is a structured product object with a name, a price, and a merchant link; the product-card rate is the share of answers with at least one; Study 2 rates use the 22,335 de-duplicated answers; brand and source types come from one rule set applied to both studies.
Each stage section below has the same shape: what shoppers ask, whether the engines show cards, who fills the cards, who is cited, what the answer looks like, the price and rating profile, and an interpretation with its confidence label. Each section ends with four tables: the measures by study and engine, the brands most often in the cards, the merchants hosting them, and the most-cited domains, followed by example questions drawn from the data. Study 2 cells have 199 to 700 answers per engine and stage; Study 1 cells have 427 to 1,260. Perplexity's brand and merchant tables are omitted where fewer than 30 answers carry cards.
Numbers in the text are rounded; the tables carry one decimal.
2. The Backbone
Table 1. Product-card rate by intent stage, both studies, with 95% Wilson intervals, and the share of Study 2 questions that received a card on at least one engine.
| Intent stage | Study 1, ChatGPT (95% CI) | n | Study 2, pooled (95% CI) | n | Card on at least one engine | Card on no engine |
|---|---|---|---|---|---|---|
| Problem Recognition | 39.8% (36.6 to 43.0) | 900 | 20.4% (18.9 to 21.9) | 2,800 | 52.1% | 47.9% |
| Category Exploration | 72.2% (69.2 to 75.0) | 900 | 37.8% (36.0 to 39.7) | 2,704 | 85.3% | 14.8% |
| Budget Framing | 88.8% (86.8 to 90.5) | 1,080 | 54.8% (52.6 to 56.9) | 2,000 | 97.4% | 2.6% |
| Attribute Constrained | 81.8% (79.6 to 83.9) | 1,260 | 47.0% (45.1 to 48.9) | 2,652 | 95.5% | 4.5% |
| Comparison | 15.3% (13.1 to 17.8) | 900 | 35.7% (33.8 to 37.6) | 2,484 | 84.6% | 15.5% |
| Validation / Risk Reduction | 8.3% (6.7 to 10.3) | 900 | 26.2% (24.5 to 28.1) | 2,240 | 68.4% | 31.6% |
| Scenario Confirmation | 80.8% (78.5 to 82.9) | 1,253 | 39.6% (37.8 to 41.4) | 2,784 | 85.0% | 14.9% |
| Purchase Execution | 93.0% (91.1 to 94.5) | 900 | 43.0% (41.2 to 44.9) | 2,672 | 87.6% | 12.4% |
| Post Purchase | 2.8% (1.6 to 4.8) | 427 | 14.7% (13.2 to 16.3) | 1,999 | 42.9% | 57.1% |
Figure 1. Product-card rate by stage, Study 1 against Study 2 pooled. The studies agree at the top (Budget, Attribute, Scenario, Purchase) and bottom (Post Purchase, Problem) and disagree at Comparison and Validation.
Table 2. Product-card rate by intent stage and engine, Study 2.
| Intent stage | Google AI Mode (n) | Copilot (n) | ChatGPT (n) | Perplexity (n) |
|---|---|---|---|---|
| Problem Recognition | 31.7% (700) | 32.0% (700) | 17.3% (700) | 0.6% (700) |
| Category Exploration | 67.5% (676) | 52.7% (676) | 30.9% (676) | 0.3% (676) |
| Budget Framing | 88.6% (500) | 69.2% (500) | 47.0% (500) | 14.2% (500) |
| Attribute Constrained | 86.3% (663) | 50.4% (663) | 39.5% (663) | 11.8% (663) |
| Comparison | 66.7% (621) | 46.1% (621) | 29.8% (621) | 0.3% (621) |
| Validation / Risk Reduction | 54.1% (560) | 35.9% (560) | 14.3% (560) | 0.7% (560) |
| Scenario Confirmation | 74.7% (696) | 43.0% (696) | 31.2% (696) | 9.5% (696) |
| Purchase Execution | 72.8% (668) | 55.4% (668) | 37.6% (668) | 6.4% (668) |
| Post Purchase | 36.4% (500) | 13.8% (499) | 6.4% (500) | 2.0% (500) |
Figure 2. Product-card rate by stage and engine, Study 2. Google AI Mode leads at every stage; Perplexity is below 15% at every stage.
Figure 3. For the same question, how many of the four engines show a card, by stage. Budget Framing questions get a card on two or more engines 79% of the time; Post Purchase questions 10%.
Three observations frame everything that follows.
The ordering is stable at the extremes and engine-specific in the middle. Budget Framing is the top stage on Google AI Mode (88.6%), Copilot (69.2%), ChatGPT (47.0%), and Perplexity (14.2%), and Post Purchase is the bottom stage on all four (36.4%, 13.8%, 6.4%, 2.0%). Between those, Google AI Mode cards Comparison (66.7%) and Validation (54.1%) at rates ChatGPT never reaches for any stage in Study 2 (its maximum is 47.0%). Thirty-one of the 36 pairwise stage differences in Study 2 survive a Bonferroni correction; the five that do not are neighbours within four points in the middle of the table.
Platform exceeds stage. Google AI Mode's weakest stage (36.4%) is close to ChatGPT's strongest in Study 2 (47.0%) and above Copilot's third-weakest. A brand that measures its AI visibility on one engine measures that engine, not AI.
"No shelf anywhere" is a stage property. The share of Study 2 questions that received a card on none of the four engines runs from 2.6% (Budget Framing) to 57.1% (Post Purchase). For problem-recognition questions it is 47.9%. These questions are answered in text on every engine, and the competition at those stages is for citations, not cards.
3. The Nine Stages
3.1 Stage 1. Problem Recognition
What shoppers ask. A symptom, not a product. Study 2: "eyeshadow won't blend properly", "oily skin all day", "can't keep kids entertained indoors", "my fog light plastic lenses cracked after grazing a small branch and moisture gets inside". Study 1: "My dress is wrinkles easily?", "My dresses keep having hemline looks uneven, especially for formal gala."
Do the engines show products? Study 1: 39.8% (n = 900). Study 2: 20.4% (n = 2,800); Google AI Mode 31.7%, Copilot 32.0%, ChatGPT 17.3%, Perplexity 0.6%. 47.9% of problem questions get no card on any engine, the second-highest share after Post Purchase. Google AI Mode carries ads on 3.0% of these answers. Confirmed.
Who fills the cards. Cards are small and broad. Study 2 answers with cards hold 4.8 products and 3.0 distinct brands on average; the brand HHI is 0.005. No brand exceeds 7% of card-bearing answers on any Study 2 engine: LG, Samsung, Google, and Hisense on ChatGPT; Apple, Samsung, Sony on Google AI Mode; Sony, Samsung, Aveeno on Copilot. In Study 1 the problem stage is the one place where quality-positioned direct-to-consumer brands lead: Quince 21% of carousels, then Old Navy, Abercrombie & Fitch, and Fashion Nova at 16% each, ahead of the Lulus and Petal & Pup pair that leads every shopping stage. Study 1's cards sit on brand-owned stores 50% of the time, the highest of any stage; Study 2's 8%. Confirmed for the diversity pattern; Suggestive for the brand order (358 card-bearing answers in Study 1, 571 in Study 2).
Who is cited. The most editorial stage. Study 1: 64.8% editorial, 11.6% retail, 3.3% brand-owned. Study 2: 46.7% editorial, 20.5% community, 11.9% retail, 4.1% brand-owned. Google AI Mode's sources are 41% community, and reddit.com appears in 70.8% of its problem-stage answers; Perplexity 57.9%; ChatGPT 33.9%; Copilot 2.5%. Copilot is the only engine that cites stores for a symptom (amazon.com 9.7%, walmart.com 6.6% of its sources), alongside clevelandclinic.org and mayoclinic.org. ChatGPT's dated sources are old here: median 280 days (Study 1) and 293 days (Study 2). Confirmed.
What the answer looks like. The longest Study 1 answers (455 words) and above-average in Study 2 (394). Hedging is near its maximum (Study 1 0.75, Study 2 0.73 per 100 words; ChatGPT 1.02). Copilot ends 92.7% of these answers with a question, Google AI Mode 71.6%, ChatGPT 32.4%. ChatGPT names a single pick in 16.4%, Google AI Mode and Perplexity in 1% to 2%. A retailer is named in 14.4% of Study 2 answers and a price in 17.7%.
Rank, price, rating. Study 1: median card price $70, 78% of cards rated, mean 4.52, median 45 reviews, and the widest within-carousel price spread of any Study 1 stage (6.2× between the dearest and cheapest card). Study 2: median $45; Copilot's cards carry a median 1,574 reviews, ChatGPT 575, Google AI Mode 166. Rating correlates with position inside the carousel (Study 1 Spearman −0.23; Study 2 ChatGPT −0.08). Suggestive.
Interpretation. At this stage the engines diagnose rather than sell. Two sources in three are editorial or community pages; cards, where present, hedge across price tiers. A brand positioned on a problem ("doesn't wrinkle", "won't crack") is the exception that earns a card here, as Quince does in Study 1.
Table 1.1. Problem Recognition: measures by study and engine. n answers: Study 1, ChatGPT 900, Study 2, pooled 2,800, Study 2, ChatGPT 700, Study 2, Perplexity 700, Study 2, Google AI Mode 700, Study 2, Copilot 700.
| Measure | Study 1, ChatGPT | Study 2, pooled | Study 2, ChatGPT | Study 2, Perplexity | Study 2, Google AI Mode | Study 2, Copilot |
|---|---|---|---|---|---|---|
| Product-card rate | 39.8% | 20.4% | 17.3% | 0.6% | 31.7% | 32.0% |
| Products per card-bearing answer | 7.9 | 4.8 | 4.0 | 6.8 | 3.7 | 6.2 |
| Distinct brands per card-bearing answer | 5.3 | 3.0 | 2.8 | 1.7 | 2.4 | 3.6 |
| Top-3 brand share of slots | 10.8% | 6.5% | 9.0% | 87.5% | 9.8% | 3.8% |
| Brand HHI | 0.014 | 0.005 | 0.010 | 0.312 | 0.010 | 0.003 |
| Slots on brand-owned store | 50.2% | 7.9% | 24.1% | 0.0% | — | 3.3% |
| Slots on a marketplace | 6.8% | 23.3% | 1.7% | 0.0% | — | 30.2% |
| Top merchant share of slots | 5.4% | 15.7% | 9.3% | 22.2% | 8.8% | 25.7% |
| Sources per answer | 21.6 | 9.8 | 13.2 | 9.9 | 10.5 | 5.7 |
| Answers citing no source | 0.6% | 9.5% | 6.4% | 0.1% | 28.1% | 3.3% |
| Editorial share of sources | 64.8% | 46.7% | 55.9% | 49.1% | 35.5% | 42.1% |
| Retail share of sources | 11.6% | 11.9% | 12.0% | 8.3% | 6.6% | 27.3% |
| Brand-owned share of sources | 3.3% | 4.1% | 3.9% | 3.1% | 6.2% | 2.7% |
| Marketplace share of sources | 9.8% | 3.8% | 2.1% | 5.0% | 0.6% | 11.6% |
| Community share of sources | 2.1% | 20.5% | 9.2% | 23.9% | 41.4% | 2.5% |
| Answers citing reddit.com | 20.3% | 39.5% | 33.9% | 57.9% | 70.8% | 2.5% |
| Words per answer (mean) | 455 | 394 | 410 | 396 | 390 | 380 |
| Hedging phrases per 100 words | 0.75 | 0.73 | 1.02 | 0.79 | 0.49 | 0.62 |
| Asks a clarifying question | 53.1% | 64.7% | 32.4% | 62.1% | 71.6% | 92.7% |
| Names a single pick | 23.0% | 9.5% | 16.4% | 1.4% | 2.4% | 17.9% |
| Names a retailer | 25.1% | 14.4% | 19.7% | 8.9% | 20.6% | 8.3% |
| Quotes a price | 43.9% | 17.7% | 20.1% | 1.9% | 23.3% | 25.4% |
| Card price, median (USD) | $70 | $45 | $60 | $112 | $109 | $35 |
| Cards with a rating | 78.3% | 61.3% | 69.9% | 3.7% | 43.7% | 69.8% |
| Mean rating | 4.52 | 4.50 | 4.49 | 4.80 | 4.57 | 4.48 |
| Review count, median | 45 | 605 | 575 | 0 | 166 | 1,574 |
| Cards with 100+ reviews | 39.9% | 71.1% | 71.7% | 0.0% | 58.1% | 75.0% |
| Rating vs rank, Spearman | -0.23 | -0.06 | -0.08 | — | -0.03 | -0.05 |
Table 1.2. Problem Recognition: brands most often in the cards (share of card-bearing answers that include the brand; Perplexity omitted where fewer than 30 answers carry cards).
| Study, engine | Top brands |
|---|---|
| Study 1, ChatGPT | Quince 21%; Old Navy 16%; Abercrombie & Fitch 16%; Fashion Nova 16%; Lulus 15%; Petal & Pup 14% |
| Study 2, ChatGPT | LG 7%; Samsung 7%; Google 7%; Hisense 7%; Shark 5%; ASUS 5% |
| Study 2, Google AI Mode | Apple 7%; Samsung 5%; Sony 5%; Google 4%; Shark 4%; HOKA 4% |
| Study 2, Copilot | Sony 4%; Samsung 3%; Aveeno 3%; Google 3%; LG 2%; Apple 2% |
Table 1.3. Problem Recognition: merchants hosting the cards (share of card slots).
| Study, engine | Top merchants |
|---|---|
| Study 1, ChatGPT | Etsy 5%; Quince 4%; Macy's 4%; Fashion Nova 3% |
| Study 2, ChatGPT | Best Buy 9%; Target 8%; Walmart 7%; Walmart.com 2% |
| Study 2, Google AI Mode | Best Buy 9%; Walmart 6%; Target 5%; Home Depot 3% |
| Study 2, Copilot | Amazon.com 26%; Walmart 19%; Target 3%; Best Buy 2% |
Table 1.4. Problem Recognition: most-cited domains (share of cited sources).
| Study, engine | Top cited domains |
|---|---|
| Study 1, ChatGPT | alibaba.com 9.6%; shunvogue.com 2.5%; azazie.com 1.6%; alldressy.com 1.4%; reddit.com 1.2%; tellar.co.uk 1.1% |
| Study 2, ChatGPT | reddit.com 7.1%; healthline.com 2.2%; alibaba.com 1.9%; engineerfix.com 1.9%; clevelandclinic.org 1.6%; nih.gov 1.3% |
| Study 2, Google AI Mode | reddit.com 14.4%; youtube.com 13.2%; facebook.com 5.3%; instagram.com 1.9%; quora.com 1.8%; tiktok.com 1.3% |
| Study 2, Copilot | amazon.com 9.7%; walmart.com 6.6%; clevelandclinic.org 2.2%; youtube.com 1.4%; mayoclinic.org 1.4%; target.com 1.2% |
| Study 2, Perplexity | reddit.com 11.0%; youtube.com 7.9%; alibaba.com 4.6%; healthline.com 0.9%; oreateai.com 0.6%; medicalnewstoday.com 0.5% |
Example questions, Problem Recognition. Study 1: "My bodycon dress is dress feels too short even though it said ribbed. What should I trust more, fabric or reviews?" · "My dresses keep having hemline looks uneven, especially for formal gala. What cut or fabric should I try?" · "I am trying to make a smart purchase decision. I need a dress that will not be too loose around the hips in photos. What should I look for? I care about value and reliability." · "Quick question. My maxi dress is fabric feels cheap and I cannot return it. What should I do next time? If you had to pick one option, what would it be?"
Study 2: "can't keep kids entertained indoors" · "my fog light plastic lenses cracked after grazing a small branch and moisture gets inside shorting the bulb I need glass or polycarbonate handling light impacts and debris on gravel roads without fracturing" · "My phone is so old it can't run half the apps I need anymore, should I just get a new one?" · "eyeshadow won't blend properly"
3.2 Stage 2. Category Exploration
What shoppers ask. Browsing with no constraint. Study 2: "best steering wheel covers", "smart home device types and what each one does", "setting sprays and powders explained", "looking for games that won't bore adults but are still appropriate for kids to play along". Study 1: "What is a good black dress right now?", "I need a mini dress?"
Do the engines show products? Study 1: 72.2% (n = 900). Study 2: 37.8% (n = 2,704); Google AI Mode 67.5%, Copilot 52.7%, ChatGPT 30.9%, Perplexity 0.3%. 85.3% of exploration questions get a card on at least one engine; none get one on all four. Google AI Mode's ad rate is 5.2%. Confirmed.
Who fills the cards. The widest and flattest shelves in both studies. Study 1: 8.0 products and 5.5 distinct brands per carousel, the most brands of any stage. Study 2: 6.3 products and 3.7 brands per answer; brand HHI 0.003 to 0.005. Study 1: Lulus 34% of carousels, Petal & Pup 26%, Old Navy 22%, H&M 19%, Quince 17%, Ann Taylor 17%. Study 2: no brand above 6% on any engine (Samsung and Nike on ChatGPT; Apple, Samsung, Google, Breville on Google AI Mode; Samsung, Amazon, Sony, Gaiam on Copilot). Merchants: Walmart leads ChatGPT's and Google AI Mode's cards (12%, 10%); Amazon.com holds 28% of Copilot's. Marketplace share of Study 2 slots is 22% (Copilot 31%). Confirmed.
Who is cited. Editorial-led. Study 1: 57.0% editorial, 19.4% retail, 9.6% brand-owned. Study 2: 54.5% editorial, 14.6% retail, 15.6% community. ChatGPT is at its most editorial here (61.8%: tomsguide.com, consumerreports.org, goodhousekeeping.com, and the Reddit-scraper sites gummysearch.com and redditrecs.com). Google AI Mode: youtube.com 12.2%, reddit.com 9.3%. Reddit appears in 26.1% of Study 2 answers (Google AI Mode 45.8%). ChatGPT's dated sources are fresher than at the problem stage (median 167 days in Study 2). Confirmed.
What the answer looks like. Long and structured: Study 2 443 words, ChatGPT 487 (its longest stage), with headings in 98.6% of ChatGPT answers. Hedging is low (Study 2 0.55 per 100 words). ChatGPT names a single pick in 45.7% of exploration answers, Google AI Mode 20.9%, Perplexity 11.5%. A price appears in 81.4% of Study 1 answers but 35.5% of Study 2's.
Rank, price, rating. Study 1: median $80 (quartiles $45 to $120), 83% of cards rated, median 45 reviews. Study 2: median $53; Copilot median 1,788 reviews, Google AI Mode 143. The within-answer price spread is 5.8× (Study 1) and 4.3× (Study 2): exploration shelves span tiers on purpose.
Interpretation. Exploration is where Google AI Mode and Copilot are most generous with cards and where ChatGPT's full models reach 88% (chapter 2); the 30.9% headline is the served-model mixture. The shelf is widest here, so a brand's chance of being one of the four to eight is highest and its chance of being the single pick lowest. In Study 1 the same five brands hold 60% to 70% of carousels at every exploratory stage.
Table 2.1. Category Exploration: measures by study and engine. n answers: Study 1, ChatGPT 900, Study 2, pooled 2,704, Study 2, ChatGPT 676, Study 2, Perplexity 676, Study 2, Google AI Mode 676, Study 2, Copilot 676.
| Measure | Study 1, ChatGPT | Study 2, pooled | Study 2, ChatGPT | Study 2, Perplexity | Study 2, Google AI Mode | Study 2, Copilot |
|---|---|---|---|---|---|---|
| Product-card rate | 72.2% | 37.8% | 30.9% | 0.3% | 67.5% | 52.7% |
| Products per card-bearing answer | 8.0 | 6.3 | 5.2 | 7.5 | 6.9 | 6.1 |
| Distinct brands per card-bearing answer | 5.5 | 3.7 | 3.5 | 2.5 | 3.7 | 3.7 |
| Top-3 brand share of slots | 17.3% | 5.3% | 4.9% | 92.3% | 6.5% | 5.7% |
| Brand HHI | 0.020 | 0.003 | 0.004 | 0.444 | 0.005 | 0.003 |
| Slots on brand-owned store | 48.2% | 8.0% | 16.9% | 0.0% | — | 4.3% |
| Slots on a marketplace | 5.6% | 22.4% | 1.7% | 0.0% | — | 31.2% |
| Top merchant share of slots | 5.6% | 13.2% | 11.6% | 33.3% | 10.1% | 27.8% |
| Sources per answer | 20.6 | 9.4 | 12.1 | 9.9 | 8.8 | 6.8 |
| Answers citing no source | 1.1% | 8.3% | 12.3% | 0.0% | 20.0% | 1.0% |
| Editorial share of sources | 57.0% | 54.5% | 61.8% | 60.9% | 47.3% | 41.4% |
| Retail share of sources | 19.4% | 14.6% | 11.1% | 9.5% | 10.6% | 33.3% |
| Brand-owned share of sources | 9.6% | 3.3% | 2.8% | 2.9% | 4.8% | 2.9% |
| Marketplace share of sources | 6.1% | 4.3% | 1.1% | 2.7% | 2.2% | 15.2% |
| Community share of sources | 0.8% | 15.6% | 14.1% | 16.9% | 28.0% | 0.5% |
| Answers citing reddit.com | 6.2% | 26.1% | 33.9% | 28.6% | 45.8% | 0.6% |
| Words per answer (mean) | 396 | 443 | 487 | 428 | 451 | 407 |
| Hedging phrases per 100 words | 0.31 | 0.55 | 0.66 | 0.78 | 0.32 | 0.42 |
| Asks a clarifying question | 70.0% | 63.1% | 38.3% | 60.7% | 62.0% | 91.4% |
| Names a single pick | 26.2% | 26.4% | 45.7% | 11.5% | 20.9% | 27.5% |
| Names a retailer | 51.4% | 27.5% | 40.8% | 14.6% | 39.3% | 15.1% |
| Quotes a price | 81.4% | 35.5% | 39.8% | 4.9% | 55.3% | 42.0% |
| Card price, median (USD) | $80 | $53 | $45 | $950 | $72 | $48 |
| Cards with a rating | 83.4% | 58.0% | 74.1% | 6.7% | 43.7% | 71.0% |
| Mean rating | 4.49 | 4.54 | 4.54 | 5.00 | 4.58 | 4.51 |
| Review count, median | 45 | 502 | 568 | 0 | 143 | 1,788 |
| Cards with 100+ reviews | 39.2% | 71.2% | 70.6% | 0.0% | 58.4% | 78.0% |
| Rating vs rank, Spearman | -0.21 | -0.04 | -0.04 | — | -0.09 | -0.05 |
Table 2.2. Category Exploration: brands most often in the cards (share of card-bearing answers that include the brand; Perplexity omitted where fewer than 30 answers carry cards).
| Study, engine | Top brands |
|---|---|
| Study 1, ChatGPT | Lulus 34%; Petal & Pup 26%; Old Navy 22%; H&M 19%; Quince 17%; Ann Taylor 17% |
| Study 2, ChatGPT | Samsung 5%; Nike 5%; Sony 3%; LG 3%; Google 3%; La Roche-Posay 3% |
| Study 2, Google AI Mode | Apple 6%; Samsung 5%; Google 5%; Breville 4%; Sony 4%; La Roche-Posay 4% |
| Study 2, Copilot | Samsung 4%; Amazon 3%; Sony 3%; Gaiam 3%; CeraVe 2%; Chanel 2% |
Table 2.3. Category Exploration: merchants hosting the cards (share of card slots).
| Study, engine | Top merchants |
|---|---|
| Study 1, ChatGPT | Petal & Pup USA 6%; Macy's 5%; Lulus 5%; Etsy 5% |
| Study 2, ChatGPT | Walmart 12%; Target 10%; Best Buy 5%; Sephora 3% |
| Study 2, Google AI Mode | Walmart 10%; Target 6%; Sephora 5%; Tire Rack 3% |
| Study 2, Copilot | Amazon.com 28%; Walmart 16%; Target 4%; Best Buy 3% |
Table 2.4. Category Exploration: most-cited domains (share of cited sources).
| Study, engine | Top cited domains |
|---|---|
| Study 1, ChatGPT | alibaba.com 4.8%; summersalt.com 2.2%; yahoo.com 1.5%; whowhatwear.com 1.5%; edwinvonholy.com 1.4%; alldressy.com 1.3% |
| Study 2, ChatGPT | reddit.com 8.7%; tomsguide.com 1.8%; consumerreports.org 1.6%; goodhousekeeping.com 1.3%; gummysearch.com 1.2%; rtings.com 0.9% |
| Study 2, Google AI Mode | youtube.com 12.2%; reddit.com 9.3%; facebook.com 2.7%; amazon.com 1.8%; instagram.com 1.2%; rtings.com 1.0% |
| Study 2, Copilot | amazon.com 13.2%; walmart.com 7.4%; target.com 2.0%; bestbuy.com 1.6%; forbes.com 1.3%; goodhousekeeping.com 0.8% |
| Study 2, Perplexity | youtube.com 11.0%; reddit.com 4.3%; alibaba.com 2.4%; goodhousekeeping.com 1.3%; consumerreports.org 1.1%; cnet.com 0.9% |
Example questions, Category Exploration. Study 1: "What is a good slip dress that I can wear a lot?" · "What sweater dress would you recommend for someone who does not wear dresses often?" · "I am trying to make a smart purchase decision. What should I avoid when buying a floral dress online? I care about value and reliability." · "What is a good black dress right now?"
Study 2: "looking for games that won't bore adults but are still appropriate for kids to play along, is that even possible or am I asking too much" · "best steering wheel covers" · "smart home device types and what each one does" · "setting sprays and powders explained"
3.3 Stage 3. Budget Framing
What shoppers ask. A price cap, often alone. Study 2: "best $500 phone", "cheap laptop that works well", "what are the best first aid kits under twenty five dollars for home use", "I rent and want to filter my tap water what fifty dollar options actually remove lead and chlorine versus just improving taste". Study 1: "Trying to stay under $60?", "What is a good dress for cocktail party under $25?"
Do the engines show products? Study 1: 88.8% (n = 1,080). Study 2: 54.8% (n = 2,000), the highest stage: Google AI Mode 88.6%, Copilot 69.2%, ChatGPT 47.0%, Perplexity 14.2%, Perplexity's best stage. 97.4% of budget questions get a card on at least one engine and 5.6% on all four, the highest "all four" share of any stage. Home and Toys have no budget questions in Study 2. Confirmed.
Who fills the cards. Store brands. On ChatGPT, Ozark Trail 7%, Equate 5%, up&up 5%, and Great Value 4% of card-bearing answers sit beside Samsung 8%; on Copilot, Amazon Basics, Kroger, and Great Value; on Google AI Mode, e.l.f. and CeraVe join Samsung, Google, and Apple. Merchant concentration jumps: Walmart hosts 17% of ChatGPT's slots, 23% of Google AI Mode's, and 32% of Copilot's, whose top three merchants hold 61% of slots. Study 1: Lulus 31%, Petal & Pup 25%, Fashion Nova 21%, Old Navy 20%, Time and Tru (Walmart's label) 13%, Windsor 12%; 40% of Study 1's slots are on brand-owned stores, 5% of Study 2's. Confirmed.
Who is cited. Retail rises. Study 1: 42.7% retail, 34.5% editorial, 13.2% brand-owned (nordstromrack.com, yahoo.com, nordstrom.com). Study 2: 27.4% retail, 42.4% editorial, 17.2% community; Copilot 50.6% retail plus 17.1% marketplace (walmart.com 20.9%, amazon.com 15.1% of its sources). ChatGPT answers budget questions without citing any source 29.0% of the time, its highest share of any stage; Google AI Mode 19.4%. Reddit appears in 29.9% of Study 2 answers (Perplexity 48.4%). Confirmed.
What the answer looks like. The shortest Study 1 answers (358 words) with the lowest hedging (0.28 per 100 words). ChatGPT names a single pick in 63.0% of budget answers, its highest; Copilot 49.6%; Google AI Mode 17.8%; Perplexity 10.4%. A price is quoted in 89% to 100% of answers on every engine; a retailer is named in 68% to 76% of ChatGPT and Google AI Mode answers.
Rank, price, rating. Cheap cards: Study 1 median $59; Study 2 median $28 (ChatGPT $32, Google AI Mode $25, Copilot $21; Perplexity $160, currency-contaminated). The within-answer price spread is the tightest of any stage (Study 2 2.2×). Review counts are high on Copilot (median 2,546) and ChatGPT (517); Study 1 median 32. Compliance with the stated cap is analyzed in chapter 5: 14% of Study 1's capped products and 19% to 27% of Study 2's exceed the cap.
Interpretation. Budget Framing is the one stage where every engine is at or near its own maximum: the cap is the strongest universal trigger. What it surfaces is the retailer's own catalog. On three of four engines a "$X" question is answered with Walmart, Target, or Amazon private labels; a direct-to-consumer brand reaches this shelf only if it is sold at those retailers or its own store feeds the index, as in Study 1. ChatGPT's sourceless budget answers show that the cards come from a product index, not from the pages the answer cites.
Table 3.1. Budget Framing: measures by study and engine. n answers: Study 1, ChatGPT 1,080, Study 2, pooled 2,000, Study 2, ChatGPT 500, Study 2, Perplexity 500, Study 2, Google AI Mode 500, Study 2, Copilot 500.
| Measure | Study 1, ChatGPT | Study 2, pooled | Study 2, ChatGPT | Study 2, Perplexity | Study 2, Google AI Mode | Study 2, Copilot |
|---|---|---|---|---|---|---|
| Product-card rate | 88.8% | 54.8% | 47.0% | 14.2% | 88.6% | 69.2% |
| Products per card-bearing answer | 8.0 | 5.8 | 4.2 | 6.7 | 6.9 | 5.5 |
| Distinct brands per card-bearing answer | 4.9 | 3.4 | 2.8 | 2.6 | 3.7 | 3.6 |
| Top-3 brand share of slots | 18.9% | 7.1% | 9.7% | 42.5% | 7.7% | 4.6% |
| Brand HHI | 0.024 | 0.006 | 0.009 | 0.087 | 0.008 | 0.004 |
| Slots on brand-owned store | 39.7% | 5.3% | 10.5% | 8.6% | — | 2.0% |
| Slots on a marketplace | 6.1% | 14.9% | 1.0% | 0.0% | — | 25.1% |
| Top merchant share of slots | 6.4% | 22.9% | 17.3% | 5.6% | 22.6% | 31.8% |
| Sources per answer | 19.2 | 7.9 | 9.5 | 10.8 | 5.0 | 6.2 |
| Answers citing no source | 7.7% | 12.3% | 29.0% | 0.0% | 19.4% | 0.8% |
| Editorial share of sources | 34.5% | 42.4% | 47.8% | 47.5% | 39.2% | 27.6% |
| Retail share of sources | 42.7% | 27.4% | 24.0% | 21.3% | 18.2% | 50.6% |
| Brand-owned share of sources | 13.2% | 1.9% | 1.4% | 1.8% | 3.7% | 1.3% |
| Marketplace share of sources | 4.1% | 6.0% | 1.6% | 4.0% | 4.8% | 17.1% |
| Community share of sources | 0.8% | 17.2% | 19.7% | 18.7% | 29.9% | 0.3% |
| Answers citing reddit.com | 5.4% | 29.9% | 39.7% | 48.4% | 34.5% | 0.4% |
| Words per answer (mean) | 358 | 405 | 420 | 378 | 414 | 409 |
| Hedging phrases per 100 words | 0.28 | 0.66 | 0.67 | 1.11 | 0.45 | 0.43 |
| Asks a clarifying question | 78.4% | 69.8% | 43.0% | 71.0% | 73.0% | 92.4% |
| Names a single pick | 29.0% | 35.2% | 63.0% | 10.4% | 17.8% | 49.6% |
| Names a retailer | 69.4% | 54.9% | 67.6% | 37.6% | 75.8% | 38.8% |
| Quotes a price | 99.7% | 94.8% | 95.4% | 88.6% | 98.2% | 97.0% |
| Card price, median (USD) | $59 | $28 | $32 | $160 | $25 | $21 |
| Cards with a rating | 75.4% | 53.4% | 70.2% | 16.3% | 43.3% | 70.4% |
| Mean rating | 4.49 | 4.49 | 4.47 | 4.45 | 4.54 | 4.46 |
| Review count, median | 32 | 257 | 517 | 0 | 115 | 2,546 |
| Cards with 100+ reviews | 33.2% | 59.2% | 67.7% | 5.9% | 53.2% | 76.7% |
| Rating vs rank, Spearman | -0.17 | -0.03 | -0.08 | — | -0.05 | -0.09 |
Table 3.2. Budget Framing: brands most often in the cards (share of card-bearing answers that include the brand; Perplexity omitted where fewer than 30 answers carry cards).
| Study, engine | Top brands |
|---|---|
| Study 1, ChatGPT | Lulus 31%; Petal & Pup 25%; Fashion Nova 21%; Old Navy 20%; Time and Tru 13%; Windsor 12% |
| Study 2, ChatGPT | Samsung 8%; Ozark Trail 7%; EQUATE 5%; up&up 5%; Great Value 4%; Soundcore 4% |
| Study 2, Google AI Mode | Samsung 8%; Google 7%; CeraVe 5%; Apple 5%; e.l.f. 4%; adidas 4% |
| Study 2, Copilot | TCL 4%; CeraVe 4%; Samsung 3%; Amazon Basics 3%; Kroger 3%; Great Value 3% |
Table 3.3. Budget Framing: merchants hosting the cards (share of card slots).
| Study, engine | Top merchants |
|---|---|
| Study 1, ChatGPT | Walmart 6%; Petal & Pup USA 6%; Lulus 5%; Macy's 4% |
| Study 2, ChatGPT | Walmart 17%; Target 9%; Best Buy 6%; Walmart.com 3% |
| Study 2, Google AI Mode | Walmart 23%; Best Buy 8%; Target 8%; Ulta Beauty 2% |
| Study 2, Copilot | Walmart 32%; Amazon.com 23%; Target 6%; Best Buy 3% |
Table 3.4. Budget Framing: most-cited domains (share of cited sources).
| Study, engine | Top cited domains |
|---|---|
| Study 1, ChatGPT | nordstromrack.com 5.3%; yahoo.com 4.6%; nordstrom.com 4.4%; alibaba.com 2.8%; windsorstore.com 2.6%; summersalt.com 2.5% |
| Study 2, ChatGPT | reddit.com 12.5%; walmart.com 2.5%; alibaba.com 1.2%; tomsguide.com 1.2%; target.com 1.2%; redrecs.com 1.2% |
| Study 2, Google AI Mode | youtube.com 15.2%; reddit.com 8.9%; walmart.com 4.2%; amazon.com 4.2%; facebook.com 2.2%; target.com 2.2% |
| Study 2, Copilot | walmart.com 20.9%; amazon.com 15.1%; target.com 4.5%; bestbuy.com 2.3%; ulta.com 1.6%; walgreens.com 0.9% |
| Study 2, Perplexity | youtube.com 10.8%; reddit.com 6.3%; alibaba.com 3.4%; accio.com 1.6%; cnet.com 1.4%; target.com 1.4% |
Example questions, Budget Framing. Study 1: "I am trying to make a smart purchase decision. Best value fit and flare dress under $350 that looks good and lasts? I care about value and reliability." · "I do not want to spend more than $75 right now?" · "Quick question. What is a good white dress for everyday wear under $120? If you had to pick one option, what would it be?" · "What is a good dress for cocktail party under $25?"
Study 2: "what are the best first aid kits under twenty five dollars for home use" · "cheap laptop that works well" · "I need to buy a laptop for my teenager and I'd like to stay under $500, what should I look at?" · "I rent and want to filter my tap water what fifty dollar options actually remove lead and chlorine versus just improving taste"
3.4 Stage 4. Attribute Constrained
What shoppers ask. Two or more hard attributes. Study 2: "TV with HDMI 2.1", "led bulbs with built in canbus decoder because my car throws errors", "baby toys that are actually safe to put in the mouth, preferably silicone or wood", "smart home stuff I can set up without installing anything permanent". Study 1: "black dress that is breathable and flattering for women over 40", "sweater dress with linen that does not shrink after washing".
Do the engines show products? Study 1: 81.8% (n = 1,260). Study 2: 47.0% (n = 2,652); Google AI Mode 86.3%, Copilot 50.4%, ChatGPT 39.5%, Perplexity 11.8%. 95.5% of attribute questions get a card somewhere. Google AI Mode's ad rate is 5.3%. Confirmed.
In Study 1 this stage carries the phrasing-style collapse: Short 100.0%, Medium 98.7%, Long 99.0%, Messy 98.7%, Conversational 25.8%. In Study 2 the style effect at this stage is small on every engine (Google AI Mode 79% to 92%, Copilot 49% to 52%, Perplexity 11% to 14%, ChatGPT 35% to 46%; ChatGPT's full models card 91% to 95% of attribute questions, styles pooled). Section 5 reports the grids.
Who fills the cards. Study 1: Lulus 33%, Quince 15%, Petal & Pup 15%, Ann Taylor 14%, LOFT 12%, Fashion Nova 10%; 4.8 brands per carousel. Study 2: Samsung 6% to 7% on every engine, then Sony, LG, Apple, Google, ASUS, Dell; the stage is electronics-heavy by construction. 3.1 brands per answer; HHI 0.005. Merchants: Walmart, Target, and Best Buy at about 8% each on ChatGPT and Google AI Mode; Amazon.com holds 32% of Copilot's slots and Copilot's marketplace share peaks here at 37%. Study 1's cards sit on brand-owned stores 45% of the time. Confirmed.
Who is cited. The most retail-cited stage after Purchase Execution, and Study 1's peak for brand-owned citations. Study 1: 44.5% retail, 27.3% editorial, 18.0% brand-owned (summersalt.com, walmart.com, dillards.com, target.com). Study 2: 31.1% retail, 34.9% editorial, 12.6% community; Google AI Mode cites amazon.com for 7.5% of its sources. ChatGPT's no-source share is 21.7%. Confirmed.
What the answer looks like. The lowest hedging of any Study 2 stage (0.43 per 100 words; Google AI Mode 0.22): specific questions get confident answers. ChatGPT names a single pick in 57.8%. A price appears in 93.8% of Study 1 answers and 41.5% of Study 2's (Google AI Mode 77.7%).
Rank, price, rating. Study 1: median $75, 70% rated, median 21 reviews. Study 2: median $60; Copilot median 1,052 reviews, ChatGPT 419, Google AI Mode 113. Rating against rank: Study 1 −0.18, Study 2 ChatGPT −0.12.
Interpretation. Attributes are matched from product data. The attribute stage is Google AI Mode's single best stage (86.3%), the one where Amazon dominates Copilot's shelf, and the one where brand-owned domains are cited most in Study 1 (18.0%): specifications send the engine to the product page. The conversational collapse of Study 1 does not generalize to the other engines or to ChatGPT's full models.
Table 4.1. Attribute Constrained: measures by study and engine. n answers: Study 1, ChatGPT 1,260, Study 2, pooled 2,652, Study 2, ChatGPT 663, Study 2, Perplexity 663, Study 2, Google AI Mode 663, Study 2, Copilot 663.
| Measure | Study 1, ChatGPT | Study 2, pooled | Study 2, ChatGPT | Study 2, Perplexity | Study 2, Google AI Mode | Study 2, Copilot |
|---|---|---|---|---|---|---|
| Product-card rate | 81.8% | 47.0% | 39.5% | 11.8% | 86.3% | 50.4% |
| Products per card-bearing answer | 8.0 | 5.9 | 4.2 | 6.3 | 6.8 | 5.5 |
| Distinct brands per card-bearing answer | 4.8 | 3.1 | 2.8 | 2.3 | 3.3 | 3.2 |
| Top-3 brand share of slots | 14.6% | 7.6% | 5.8% | 38.6% | 7.7% | 5.0% |
| Brand HHI | 0.016 | 0.005 | 0.005 | 0.086 | 0.006 | 0.003 |
| Slots on brand-owned store | 45.1% | 8.0% | 17.9% | 4.3% | — | 4.1% |
| Slots on a marketplace | 8.5% | 21.9% | 2.7% | 0.0% | — | 37.3% |
| Top merchant share of slots | 6.9% | 11.4% | 8.1% | 8.6% | 7.6% | 31.6% |
| Sources per answer | 20.3 | 8.3 | 10.6 | 10.6 | 6.1 | 5.8 |
| Answers citing no source | 5.8% | 9.7% | 21.7% | 0.6% | 14.2% | 2.3% |
| Editorial share of sources | 27.3% | 34.9% | 40.4% | 35.8% | 30.7% | 27.8% |
| Retail share of sources | 44.5% | 31.1% | 32.4% | 32.6% | 19.4% | 38.5% |
| Brand-owned share of sources | 18.0% | 5.7% | 5.9% | 4.5% | 9.4% | 3.5% |
| Marketplace share of sources | 5.0% | 8.0% | 1.3% | 5.7% | 8.4% | 23.9% |
| Community share of sources | 1.5% | 12.6% | 11.8% | 12.7% | 25.4% | 0.5% |
| Answers citing reddit.com | 5.9% | 24.6% | 33.5% | 37.6% | 29.0% | 0.3% |
| Words per answer (mean) | 369 | 397 | 426 | 357 | 416 | 390 |
| Hedging phrases per 100 words | 0.31 | 0.43 | 0.52 | 0.71 | 0.22 | 0.31 |
| Asks a clarifying question | 82.2% | 65.9% | 33.6% | 68.3% | 68.2% | 93.5% |
| Names a single pick | 27.3% | 27.9% | 57.8% | 7.5% | 7.8% | 38.6% |
| Names a retailer | 57.9% | 33.6% | 45.2% | 17.2% | 52.9% | 19.0% |
| Quotes a price | 93.8% | 41.5% | 43.6% | 3.8% | 77.7% | 41.0% |
| Card price, median (USD) | $75 | $60 | $65 | $179 | $69 | $41 |
| Cards with a rating | 69.5% | 49.8% | 73.6% | 14.7% | 39.0% | 68.0% |
| Mean rating | 4.50 | 4.53 | 4.54 | 4.60 | 4.55 | 4.50 |
| Review count, median | 21 | 197 | 419 | 0 | 113 | 1,052 |
| Cards with 100+ reviews | 26.7% | 58.0% | 69.7% | 3.3% | 52.9% | 75.4% |
| Rating vs rank, Spearman | -0.17 | -0.08 | -0.12 | — | -0.07 | -0.08 |
Table 4.2. Attribute Constrained: brands most often in the cards (share of card-bearing answers that include the brand; Perplexity omitted where fewer than 30 answers carry cards).
| Study, engine | Top brands |
|---|---|
| Study 1, ChatGPT | Lulus 33%; Quince 15%; Petal & Pup 15%; Ann Taylor 14%; LOFT 12%; Fashion Nova 10% |
| Study 2, ChatGPT | Samsung 6%; Sony 3%; LG 3%; Google 2%; ASUS 2%; Band-Aid 2% |
| Study 2, Google AI Mode | Apple 7%; Samsung 7%; Sony 5%; LG 4%; Google 3%; ASUS 3% |
| Study 2, Copilot | Samsung 4%; Sony 4%; LG 3%; Dell 3%; ASUS 2%; Lenovo 2% |
Table 4.3. Attribute Constrained: merchants hosting the cards (share of card slots).
| Study, engine | Top merchants |
|---|---|
| Study 1, ChatGPT | Etsy 7%; Nordstrom 5%; Lulus 5%; Macy's 4% |
| Study 2, ChatGPT | Walmart 8%; Target 8%; Best Buy 5%; Sephora 2% |
| Study 2, Google AI Mode | Walmart 8%; Best Buy 6%; Target 6%; Sephora 3% |
| Study 2, Copilot | Amazon.com 32%; Walmart 16%; Target 4%; Etsy 2% |
Table 4.4. Attribute Constrained: most-cited domains (share of cited sources).
| Study, engine | Top cited domains |
|---|---|
| Study 1, ChatGPT | summersalt.com 2.5%; walmart.com 2.5%; dillards.com 2.4%; alibaba.com 1.8%; target.com 1.7%; editorialist.com 1.6% |
| Study 2, ChatGPT | reddit.com 7.8%; walmart.com 3.1%; target.com 1.2%; rtings.com 0.9%; tomsguide.com 0.8%; homedepot.com 0.7% |
| Study 2, Google AI Mode | youtube.com 14.1%; amazon.com 7.5%; reddit.com 6.1%; facebook.com 2.0%; rtings.com 1.8%; walmart.com 1.7% |
| Study 2, Copilot | amazon.com 20.5%; walmart.com 9.3%; target.com 3.0%; etsy.com 1.3%; bestbuy.com 1.2%; kateminimalist.com 0.9% |
| Study 2, Perplexity | reddit.com 5.6%; youtube.com 5.2%; alibaba.com 3.1%; target.com 1.9%; walmart.com 1.3%; bestbuy.com 1.1% |
Example questions, Attribute Constrained. Study 1: "I need a black dress that is breathable and flattering for women over 40." · "Quick question. I want a wedding guest dress with boho style and chiffon that travels well. If you had to pick one option, what would it be?" · "Quick question. Looking for a sweater dress with linen that does not shrink after washing. If you had to pick one option, what would it be?" · "Looking for a size formal gown that is solid color?"
Study 2: "I need baby toys that are actually safe to put in the mouth because my 6-month-old chews everything, preferably silicone or wood, easy to clean, and have different textures" · "I need led bulbs with built in canbus decoder because my car throws errors and disables headlight circuit after thirty seconds with every led set I tried I need mimicking halogen resistance preventing dash errors and flickering" · "I rent my place and my landlord is strict about modifications — what smart home stuff can I set up without installing anything permanent?" · "I need an overnight lip mask that actually repairs severely chapped and cracked lips not just one that sits on top like a regular balm"
3.5 Stage 5. Comparison
What shoppers ask. Two named options or variants. Study 2: "iPhone 16 Pro vs regular iPhone 16", "65 vs 75 inch TV", "MAC eyeshadow vs Urban Decay Naked palette which gives better pigmentation and value", "Moroccanoil treatment vs generic argan oil is the brand worth the price difference". Study 1: "Zara vs ASOS for travel outfit?", "Aritzia vs Michael Kors, who has better quality for the money?"
Do the engines show products? Study 1: 15.3% (n = 900). Study 2: 35.7% (n = 2,484); Google AI Mode 66.7%, Copilot 46.1%, ChatGPT 29.8%, Perplexity 0.3%. 84.6% of comparison questions get a card somewhere. The Study 1 against Study 2 flip is real: Google AI Mode and Copilot treat "X vs Y" as a shopping query; ChatGPT, in both studies, mostly does not. Confirmed.
Who fills the cards. The narrowest shelves of all. Study 2: 1.9 distinct brands per answer, and ChatGPT's cards average 2.3 products, the two things being compared. Study 1: 2.1 brands; brand HHI rises to 0.050. Study 1's winners are the compared brands themselves: Banana Republic 14% of carousels, Everlane 12%, Michael Kors 12%, Ralph Lauren 11%, Zara 10%, H&M 10%. Study 1's marketplace share jumps to 24%, and Poshmark is its top merchant (7%): resale listings of the named brands. Study 2: Apple 9%, Sony 6%, Samsung 5% to 6% on ChatGPT and Google AI Mode. Confirmed.
Who is cited. The most Reddit-dependent stage in Study 1 (reddit.com in 52.0% of comparison answers; trustpilot.com 3.0% of sources) and near the top in Study 2 (41.6%; Google AI Mode 70.4%, Perplexity 51.7%). Editorial 47.1% (Study 1) and 46.2% (Study 2); community 10.9% and 23.2%. ChatGPT's sources are the oldest of any Study 2 stage here (median 411 days). Confirmed.
What the answer looks like. The longest and hedgiest answers. Study 1: 470 words and 1.69 hedging phrases per 100, both maxima. Study 2: 1.02 per 100 (ChatGPT 1.10, Perplexity 1.54). ChatGPT still commits to a single pick in 25.0%; Google AI Mode 9.7%, Perplexity 5.2%.
Rank, price, rating. Pricier flagship products: Study 2 median $100 (ChatGPT $118, Google AI Mode $185) with the heaviest review counts (Copilot median 8,727; Study 2 pooled 2,517). The within-answer price spread is the tightest in Study 2 (1.7× to 2.5×): both sides of the comparison are shown.
Interpretation. Comparison is where the engines disagree most about whether to sell: 0.3% against 66.7%. When ChatGPT does card a comparison it shows about two products. On three engines the answer is prose with Reddit as the evidence base; the lever for a brand is third-party comparison content and community presence rather than product data.
Table 5.1. Comparison: measures by study and engine. n answers: Study 1, ChatGPT 900, Study 2, pooled 2,484, Study 2, ChatGPT 621, Study 2, Perplexity 621, Study 2, Google AI Mode 621, Study 2, Copilot 621.
| Measure | Study 1, ChatGPT | Study 2, pooled | Study 2, ChatGPT | Study 2, Perplexity | Study 2, Google AI Mode | Study 2, Copilot |
|---|---|---|---|---|---|---|
| Product-card rate | 15.3% | 35.7% | 29.8% | 0.3% | 66.7% | 46.1% |
| Products per card-bearing answer | 8.9 | 4.5 | 2.3 | 5.5 | 3.9 | 6.6 |
| Distinct brands per card-bearing answer | 2.1 | 1.9 | 1.9 | 1.0 | 1.9 | 1.9 |
| Top-3 brand share of slots | 20.6% | 11.1% | 11.4% | 100.0% | 14.0% | 8.9% |
| Brand HHI | 0.050 | 0.010 | 0.012 | 0.755 | 0.014 | 0.010 |
| Slots on brand-owned store | 38.0% | 8.0% | 29.3% | 18.2% | — | 3.5% |
| Slots on a marketplace | 24.0% | 16.0% | 6.6% | 0.0% | — | 18.1% |
| Top merchant share of slots | 7.0% | 10.9% | 8.6% | 18.2% | 6.5% | 15.8% |
| Sources per answer | 25.3 | 10.3 | 12.6 | 9.9 | 11.9 | 6.9 |
| Answers citing no source | 0.3% | 5.8% | 9.5% | 0.0% | 13.4% | 0.2% |
| Editorial share of sources | 47.1% | 46.2% | 55.7% | 49.5% | 37.3% | 39.5% |
| Retail share of sources | 15.9% | 14.8% | 12.2% | 8.4% | 9.2% | 38.5% |
| Brand-owned share of sources | 5.3% | 5.1% | 6.4% | 4.0% | 5.7% | 3.5% |
| Marketplace share of sources | 10.7% | 4.4% | 2.9% | 5.7% | 2.2% | 9.0% |
| Community share of sources | 10.9% | 23.2% | 14.3% | 26.9% | 40.5% | 4.2% |
| Answers citing reddit.com | 52.0% | 41.6% | 37.0% | 51.7% | 70.4% | 10.6% |
| Words per answer (mean) | 470 | 412 | 416 | 457 | 414 | 362 |
| Hedging phrases per 100 words | 1.69 | 1.02 | 1.10 | 1.54 | 0.56 | 0.80 |
| Asks a clarifying question | 43.8% | 63.6% | 39.3% | 52.8% | 70.5% | 91.9% |
| Names a single pick | 28.8% | 14.1% | 25.0% | 5.2% | 9.7% | 16.6% |
| Names a retailer | 46.9% | 21.4% | 29.3% | 15.1% | 30.3% | 11.0% |
| Quotes a price | 52.3% | 33.2% | 37.8% | 6.8% | 43.8% | 44.3% |
| Card price, median (USD) | $60 | $100 | $118 | $700 | $185 | $75 |
| Cards with a rating | 53.9% | 51.1% | 79.4% | 9.1% | 22.9% | 69.1% |
| Mean rating | 4.44 | 4.55 | 4.52 | 4.70 | 4.58 | 4.56 |
| Review count, median | 11 | 2,517 | 947 | 0 | 169 | 8,727 |
| Cards with 100+ reviews | 21.9% | 80.3% | 78.7% | 0.0% | 64.3% | 83.5% |
| Rating vs rank, Spearman | -0.07 | -0.01 | 0.02 | — | 0.07 | -0.06 |
Table 5.2. Comparison: brands most often in the cards (share of card-bearing answers that include the brand; Perplexity omitted where fewer than 30 answers carry cards).
| Study, engine | Top brands |
|---|---|
| Study 1, ChatGPT | Banana Republic 14%; Everlane 12%; Michael Kors 12%; Ralph Lauren 11%; Zara 10%; H&M 10% |
| Study 2, ChatGPT | Apple 9%; Sony 6%; Samsung 6%; Google 5%; LG 3%; Dyson 3% |
| Study 2, Google AI Mode | Apple 9%; Sony 6%; Samsung 5%; Bose 3%; Google 3%; LG 3% |
| Study 2, Copilot | Samsung 6%; Apple 5%; Sony 4%; Google 3%; LEGO 3%; LG 3% |
Table 5.3. Comparison: merchants hosting the cards (share of card slots).
| Study, engine | Top merchants |
|---|---|
| Study 1, ChatGPT | Poshmark 7%; Lulus 5%; Banana Republic 5%; Anthropologie 5% |
| Study 2, ChatGPT | Walmart 9%; Best Buy 6%; Target 5%; eBay 3% |
| Study 2, Google AI Mode | Best Buy 6%; Walmart 6%; Target 3%; Tire Rack 3% |
| Study 2, Copilot | Amazon.com 16%; Walmart 13%; Target 5%; Best Buy 3% |
Table 5.4. Comparison: most-cited domains (share of cited sources).
| Study, engine | Top cited domains |
|---|---|
| Study 1, ChatGPT | alibaba.com 8.3%; apartstyle.com 8.2%; reddit.com 3.4%; trustpilot.com 3.0%; tellar.co.uk 2.4%; yahoo.com 2.4% |
| Study 2, ChatGPT | reddit.com 8.0%; alibaba.com 2.5%; rtings.com 1.4%; consumerreports.org 1.2%; walmart.com 0.9%; rei.com 0.9% |
| Study 2, Google AI Mode | reddit.com 14.2%; youtube.com 14.0%; facebook.com 4.5%; tiktok.com 1.9%; rtings.com 1.5%; instagram.com 1.5% |
| Study 2, Copilot | amazon.com 6.8%; walmart.com 5.9%; target.com 1.9%; bestbuy.com 1.7%; reddit.com 1.6%; youtube.com 1.5% |
| Study 2, Perplexity | youtube.com 13.6%; reddit.com 9.5%; alibaba.com 5.3%; rtings.com 0.8%; oreateai.com 0.8%; skinsort.com 0.7% |
Example questions, Comparison. Study 1: "Aritzia vs Michael Kors, who has better quality for the money?" · "For a black dress mainly for family photos, is Zara or Everlane the better choice?" · "Which brand has better quality dresses, Zara or Calvin Klein?" · "Quick question. If I want machine washable, is Banana Republic or Aritzia better? If you had to pick one option, what would it be?"
Study 2: "I want a paint sealant and am comparing Mothers and Turtle Wax Mothers claims synthetic polymer protection lasting six months while Turtle Wax advertises ceramic infused spray which sealant actually survives multiple car washes and maintains hydrophobic properties longer without requiring constant reapplication" · "iPhone 16 Pro vs regular iPhone 16" · "Moroccanoil treatment vs generic argan oil is the brand worth the price difference" · "MAC eyeshadow vs Urban Decay Naked palette which gives better pigmentation and value"
3.6 Stage 6. Validation / Risk Reduction
What shoppers ask. "Is it worth it, safe, legit." Study 2: "is Giro overpriced", "My friend says Hisense TVs are as good as Samsung now and I'm skeptical", "I keep seeing mixed reviews online about CeraVe and I want to know if it is genuinely safe", "are LED headlight bulbs street legal in my state". Study 1: "Is Zara good quality for a slip dress?", "What are red flags to avoid when buying a evening dress online?"
Do the engines show products? Study 1: 8.3% (n = 900). Study 2: 26.2% (n = 2,240); Google AI Mode 54.1%, Copilot 35.9%, ChatGPT 14.3%, Perplexity 0.7%. 31.6% of validation questions get no card on any engine. Toys has no validation questions in Study 2. Confirmed.
Who fills the cards. Few, flagship products. Study 2: 1.8 brands per answer; ChatGPT's cards average 2.7 products. Apple leads on every Study 2 engine (ChatGPT 8%, Google AI Mode 7%, Copilot 3%), with Garmin, Rogue, Manduka, Nature Made, Native, and Paula's Choice appearing: brands people ask "is it worth it" about. Study 1: Ann Taylor 15%, Quince 15%, Petal & Pup 13%, Boden 13%, Lulus 12%. REI enters ChatGPT's top merchants; Macy's and Nordstrom lead Study 1's. Suggestive for the brand order (Study 1 has 75 card-bearing answers at this stage).
Who is cited. Google AI Mode at its most community-based: 40.9% of its sources, and reddit.com in 78.5% of its validation answers; Perplexity 54.6%; ChatGPT 34.6%; Copilot 7.3%. Study 1: 52.3% editorial, Reddit in 32.1% of answers, trustpilot.com 1.8% of sources. epa.gov enters ChatGPT's top domains for safety questions. Confirmed.
What the answer looks like. High hedging (Study 1 1.23, Study 2 1.02 per 100 words) and the fewest single picks in Study 2 (4.0%; ChatGPT 6.1%): the engines reassure or warn rather than recommend. A retailer is named in 15.4% of Study 2 answers.
Rank, price, rating. Study 2 median $108 (ChatGPT $221); review counts heavy (Study 2 median 1,484; Copilot 3,718). Study 1 shows the strongest within-carousel rating-to-rank relation of any stage (Spearman −0.29): when a validation question does produce a carousel, better-rated products sit higher.
Interpretation. Validation is a Reddit stage: four of five Google AI Mode answers cite it. The products carded are premium flagships, and in Study 1 they are ordered by rating more than anywhere else. Perplexity never cards a validation question. Reputation on Reddit and review platforms is the answer here; a high rating earns position inside the rare carousel.
Table 6.1. Validation / Risk Reduction: measures by study and engine. n answers: Study 1, ChatGPT 900, Study 2, pooled 2,240, Study 2, ChatGPT 560, Study 2, Perplexity 560, Study 2, Google AI Mode 560, Study 2, Copilot 560.
| Measure | Study 1, ChatGPT | Study 2, pooled | Study 2, ChatGPT | Study 2, Perplexity | Study 2, Google AI Mode | Study 2, Copilot |
|---|---|---|---|---|---|---|
| Product-card rate | 8.3% | 26.2% | 14.3% | 0.7% | 54.1% | 35.9% |
| Products per card-bearing answer | 7.9 | 3.8 | 2.7 | 5.5 | 3.0 | 5.5 |
| Distinct brands per card-bearing answer | 4.3 | 1.8 | 1.7 | 2.0 | 1.7 | 2.0 |
| Top-3 brand share of slots | 14.5% | 8.7% | 11.9% | 64.3% | 12.3% | 7.7% |
| Brand HHI | 0.019 | 0.010 | 0.016 | 0.173 | 0.014 | 0.011 |
| Slots on brand-owned store | 46.3% | 10.1% | 29.5% | 0.0% | — | 7.1% |
| Slots on a marketplace | 6.6% | 18.7% | 1.7% | 0.0% | — | 21.8% |
| Top merchant share of slots | 5.8% | 12.6% | 6.1% | 4.5% | 8.4% | 17.6% |
| Sources per answer | 20.8 | 10.6 | 13.4 | 9.7 | 13.1 | 6.1 |
| Answers citing no source | 1.7% | 3.9% | 4.1% | 0.0% | 9.6% | 1.8% |
| Editorial share of sources | 52.3% | 44.7% | 51.1% | 46.2% | 36.8% | 45.0% |
| Retail share of sources | 15.6% | 12.2% | 11.0% | 10.2% | 7.5% | 28.3% |
| Brand-owned share of sources | 5.5% | 4.6% | 5.1% | 3.1% | 5.3% | 4.5% |
| Marketplace share of sources | 11.7% | 3.6% | 2.9% | 5.4% | 0.9% | 8.2% |
| Community share of sources | 6.2% | 23.3% | 14.9% | 23.8% | 40.9% | 3.1% |
| Answers citing reddit.com | 32.1% | 43.1% | 34.6% | 54.6% | 78.5% | 7.3% |
| Words per answer (mean) | 414 | 393 | 398 | 372 | 411 | 390 |
| Hedging phrases per 100 words | 1.23 | 1.02 | 1.23 | 1.28 | 0.66 | 0.94 |
| Asks a clarifying question | 42.2% | 59.2% | 37.0% | 42.5% | 66.6% | 90.9% |
| Names a single pick | 24.3% | 4.0% | 6.1% | 1.2% | 1.8% | 6.8% |
| Names a retailer | 15.6% | 15.4% | 19.8% | 7.1% | 23.9% | 10.7% |
| Quotes a price | 22.9% | 26.2% | 28.0% | 7.3% | 34.6% | 34.6% |
| Card price, median (USD) | $99 | $108 | $221 | $207 | $47 | $103 |
| Cards with a rating | 72.6% | 50.0% | 79.9% | 31.8% | 20.6% | 69.0% |
| Mean rating | 4.47 | 4.52 | 4.54 | 4.77 | 4.54 | 4.51 |
| Review count, median | 17 | 1,484 | 1,038 | 0 | 166 | 3,718 |
| Cards with 100+ reviews | 27.0% | 77.0% | 83.0% | 13.6% | 60.5% | 79.4% |
| Rating vs rank, Spearman | -0.29 | -0.06 | -0.07 | — | -0.11 | -0.03 |
Table 6.2. Validation / Risk Reduction: brands most often in the cards (share of card-bearing answers that include the brand; Perplexity omitted where fewer than 30 answers carry cards).
| Study, engine | Top brands |
|---|---|
| Study 1, ChatGPT | Ann Taylor 15%; Quince 15%; Petal & Pup 13%; Boden 13%; Lulus 12%; Ralph Lauren 8% |
| Study 2, ChatGPT | Apple 8%; Garmin 4%; Samsung 4%; Rogue 2%; Cuisinart 2%; Titan Fitness 2% |
| Study 2, Google AI Mode | Apple 7%; Sony 5%; Samsung 4%; Bose 4%; Manduka 3%; Google 3% |
| Study 2, Copilot | Apple 3%; Nature Made 2%; Sony 2%; Rogue 2%; Native 2%; Paula's Choice 2% |
Table 6.3. Validation / Risk Reduction: merchants hosting the cards (share of card slots).
| Study, engine | Top merchants |
|---|---|
| Study 1, ChatGPT | Macy's 6%; Nordstrom 5%; Ralph Lauren 5%; Lulus 3% |
| Study 2, ChatGPT | Best Buy 6%; Walmart 6%; Target 4%; REI 4% |
| Study 2, Google AI Mode | Walmart 8%; Target 5%; Best Buy 3%; Sephora 3% |
| Study 2, Copilot | Amazon.com 18%; Walmart 10%; Target 4%; Best Buy 4% |
Table 6.4. Validation / Risk Reduction: most-cited domains (share of cited sources).
| Study, engine | Top cited domains |
|---|---|
| Study 1, ChatGPT | alibaba.com 10.6%; shunvogue.com 2.4%; reddit.com 2.1%; tellar.co.uk 2.0%; trustpilot.com 1.8%; yahoo.com 1.1% |
| Study 2, ChatGPT | reddit.com 7.1%; alibaba.com 2.8%; epa.gov 1.3%; redditrecs.com 1.3%; rtings.com 1.2%; consumerreports.org 1.1% |
| Study 2, Google AI Mode | reddit.com 18.2%; youtube.com 12.2%; facebook.com 4.3%; quora.com 1.3%; instagram.com 1.3%; nih.gov 1.2% |
| Study 2, Copilot | amazon.com 6.1%; walmart.com 3.4%; bestbuy.com 1.5%; target.com 1.4%; reddit.com 1.3%; rei.com 1.0% |
| Study 2, Perplexity | reddit.com 9.7%; youtube.com 9.0%; alibaba.com 4.9%; facebook.com 0.9%; rtings.com 0.7%; healthline.com 0.7% |
Example questions, Validation / Risk Reduction. Study 1: "I am trying to make a smart purchase decision. What should I look for in reviews for a black dress? I care about value and reliability." · "Quick question. Are there common fit issues for corporate executives with wedding guest dress? If you had to pick one option, what would it be?" · "What are red flags to avoid when buying a evening dress online?" · "is it better to size up or down for a slip dress from zara?"
Study 2: "I want led headlight bulbs and need to know if they are street legal in my state because some aftermarket leds are not dot approved and can result in inspection failures and insurance issues if they cause an accident I need confirmation that the bulbs carry proper certification and meet local headlight standards" · "My friend says Hisense TVs are as good as Samsung now and I'm skeptical — are they actually reliable for the long term?" · "I have been considering CeraVe for my acne-prone skin but I keep seeing mixed reviews online and I want to know if it is genuinely safe" · "Jo Malone bottles are so tiny and expensive and I want to know if the fragrance quality is genuinely exceptional or if I am just paying for the aesthetic"
3.7 Stage 7. Scenario Confirmation
What shoppers ask. A use case. Study 2: "seat for long tours", "I want to get into PC gaming but I also need a laptop for work, can I really get one device that does both", "neighborhood block party with kids from toddlers to teenagers, outdoor toys and games", "light bar on my side by side for working after dark". Study 1: "I need a slip dress for family photos that travels well.", "I have a summer festival?"
Do the engines show products? Study 1: 80.8% (n = 1,253). Study 2: 39.6% (n = 2,784); Google AI Mode 74.7%, Copilot 43.0%, ChatGPT 31.2%, Perplexity 9.5%. Google AI Mode's ad rate peaks here at 6.0%. 85.0% of scenario questions get a card somewhere. Confirmed.
Who fills the cards. Study 1: Lulus 35% of carousels, its best stage, then Petal & Pup 24%, Ann Taylor 17%, Abercrombie & Fitch 14%, Fashion Nova 13%, Old Navy 12%; 5.2 brands per carousel. Study 2: Lenovo leads ChatGPT (6%) and Copilot (5%) on "work and play" laptop scenarios, with Samsung, HP, and LG; Google AI Mode: Samsung 8%, Apple 6%, Google 5%, Sony, CeraVe. Copilot's cards are 37% marketplace-hosted, Amazon 32% of its slots. Confirmed.
Who is cited. Study 1: 51.6% editorial, 22.3% retail, 13.3% brand-owned; summersalt.com is its top domain (3.5%), pinterest.com 1.7%. Study 2: 44.5% editorial, 19.9% retail, 15.6% community; nih.gov enters ChatGPT's top five for health scenarios. Reddit appears in 29.6% of Study 2 answers (Google AI Mode 43.8%, Perplexity 43.5%).
What the answer looks like. Long (Study 2 423 words; ChatGPT 459, Google AI Mode 454) with the lowest Study 1 hedging (0.26 per 100 words; Study 2 0.46). ChatGPT names a single pick in 49.3%; Google AI Mode quotes a price in 64.9%.
Rank, price, rating. Study 1 median $79; Study 2 median $80, the second-priciest Study 2 stage; Copilot median 1,115 reviews, ChatGPT 514, Google AI Mode 133; within-answer spread 5.5× (Study 1), 4.0× (Study 2).
Interpretation. Scenario questions are Google AI Mode's ad stage, with sponsored products on 6% of answers. A use-case catalog maps directly onto the question: it makes Lenovo a stage winner on two engines despite ranking seventh overall, and makes Scenario Lulus's strongest stage in Study 1. Occasion, activity, room, and vehicle taxonomies in product data are the matching key.
Table 7.1. Scenario Confirmation: measures by study and engine. n answers: Study 1, ChatGPT 1,253, Study 2, pooled 2,784, Study 2, ChatGPT 696, Study 2, Perplexity 696, Study 2, Google AI Mode 696, Study 2, Copilot 696.
| Measure | Study 1, ChatGPT | Study 2, pooled | Study 2, ChatGPT | Study 2, Perplexity | Study 2, Google AI Mode | Study 2, Copilot |
|---|---|---|---|---|---|---|
| Product-card rate | 80.8% | 39.6% | 31.2% | 9.5% | 74.7% | 43.0% |
| Products per card-bearing answer | 7.9 | 5.8 | 4.6 | 6.8 | 6.2 | 5.8 |
| Distinct brands per card-bearing answer | 5.2 | 3.1 | 3.0 | 2.0 | 3.1 | 3.4 |
| Top-3 brand share of slots | 17.0% | 7.8% | 7.0% | 37.8% | 9.0% | 8.1% |
| Brand HHI | 0.019 | 0.005 | 0.006 | 0.067 | 0.007 | 0.005 |
| Slots on brand-owned store | 47.5% | 8.0% | 19.5% | 4.9% | — | 3.5% |
| Slots on a marketplace | 6.4% | 21.8% | 1.7% | 0.0% | — | 36.7% |
| Top merchant share of slots | 5.2% | 11.9% | 9.2% | 2.7% | 7.4% | 31.9% |
| Sources per answer | 20.5 | 9.1 | 11.8 | 10.5 | 8.1 | 5.9 |
| Answers citing no source | 3.2% | 8.0% | 14.1% | 0.1% | 16.4% | 1.3% |
| Editorial share of sources | 51.6% | 44.5% | 46.9% | 48.8% | 38.6% | 40.3% |
| Retail share of sources | 22.3% | 19.9% | 20.0% | 18.4% | 13.8% | 30.6% |
| Brand-owned share of sources | 13.3% | 4.0% | 4.0% | 3.1% | 6.0% | 2.6% |
| Marketplace share of sources | 4.1% | 4.9% | 1.4% | 4.0% | 2.5% | 16.7% |
| Community share of sources | 2.4% | 15.6% | 13.6% | 15.6% | 29.5% | 0.9% |
| Answers citing reddit.com | 5.2% | 29.6% | 33.1% | 43.5% | 43.8% | 0.4% |
| Words per answer (mean) | 391 | 423 | 459 | 390 | 454 | 388 |
| Hedging phrases per 100 words | 0.26 | 0.45 | 0.61 | 0.62 | 0.26 | 0.34 |
| Asks a clarifying question | 70.5% | 66.2% | 37.9% | 64.4% | 68.7% | 93.8% |
| Names a single pick | 26.4% | 23.1% | 49.3% | 5.9% | 10.1% | 27.0% |
| Names a retailer | 52.5% | 22.9% | 32.9% | 11.2% | 39.4% | 8.2% |
| Quotes a price | 86.6% | 33.7% | 35.3% | 5.3% | 64.9% | 29.2% |
| Card price, median (USD) | $79 | $80 | $80 | $103 | $99 | $62 |
| Cards with a rating | 77.6% | 54.8% | 71.9% | 18.4% | 46.7% | 69.5% |
| Mean rating | 4.49 | 4.51 | 4.51 | 4.65 | 4.56 | 4.44 |
| Review count, median | 30 | 200 | 514 | 0 | 133 | 1,115 |
| Cards with 100+ reviews | 31.8% | 58.5% | 72.5% | 6.2% | 55.9% | 71.6% |
| Rating vs rank, Spearman | -0.20 | -0.04 | 0.01 | — | -0.08 | -0.03 |
Table 7.2. Scenario Confirmation: brands most often in the cards (share of card-bearing answers that include the brand; Perplexity omitted where fewer than 30 answers carry cards).
| Study, engine | Top brands |
|---|---|
| Study 1, ChatGPT | Lulus 35%; Petal & Pup 24%; Ann Taylor 17%; Abercrombie & Fitch 14%; Fashion Nova 13%; Old Navy 12% |
| Study 2, ChatGPT | Lenovo 6%; Samsung 5%; HP 4%; Ninja 3%; LG 3%; Bose 3% |
| Study 2, Google AI Mode | Samsung 8%; Apple 6%; Google 5%; Sony 4%; Lenovo 3%; CeraVe 3% |
| Study 2, Copilot | Samsung 5%; Lenovo 5%; HP 4%; LEGO 3%; LG 3%; Dell 3% |
Table 7.3. Scenario Confirmation: merchants hosting the cards (share of card slots).
| Study, engine | Top merchants |
|---|---|
| Study 1, ChatGPT | Petal & Pup USA 5%; Lulus 5%; Etsy 5%; Macy's 5% |
| Study 2, ChatGPT | Walmart 9%; Best Buy 6%; Target 6%; Sephora 3% |
| Study 2, Google AI Mode | Walmart 7%; Best Buy 7%; Target 6%; Sephora 2% |
| Study 2, Copilot | Amazon.com 32%; Walmart 21%; Target 4%; Best Buy 3% |
Table 7.4. Scenario Confirmation: most-cited domains (share of cited sources).
| Study, engine | Top cited domains |
|---|---|
| Study 1, ChatGPT | summersalt.com 3.5%; alibaba.com 2.8%; pinterest.com 1.7%; travelandleisure.com 1.7%; windsorstore.com 1.5%; yahoo.com 1.3% |
| Study 2, ChatGPT | reddit.com 8.0%; alibaba.com 1.1%; nih.gov 1.1%; walmart.com 1.0%; tomsguide.com 0.9%; mayoclinic.org 0.7% |
| Study 2, Google AI Mode | youtube.com 12.6%; reddit.com 8.8%; facebook.com 3.3%; amazon.com 2.3%; instagram.com 1.4%; nih.gov 1.0% |
| Study 2, Copilot | amazon.com 14.4%; walmart.com 8.7%; target.com 1.7%; bestbuy.com 1.4%; etsy.com 1.0%; forbes.com 0.7% |
| Study 2, Perplexity | reddit.com 6.6%; youtube.com 6.4%; alibaba.com 3.3%; bestbuy.com 0.8%; rtings.com 0.7%; nytimes.com 0.6% |
Example questions, Scenario Confirmation. Study 1: "Quick question. I need a dress for business casual setting. What style should I look for? If you had to pick one option, what would it be?" · "I need a slip dress for family photos that travels well." · "Best black dress for travel outfit that is not too casual?" · "I am trying to make a smart purchase decision. I need a floral dress for summer vacation that is mini length. Any picks? I care about value and reliability."
Study 2: "We're hosting a neighborhood block party with kids ranging from toddlers to teenagers and need outdoor toys and games that can keep different age groups entertained for several hours, our street will be closed off so we have lots of space to work with but need variety" · "I run a small farm and need a light bar on my side by side for working after dark moving equipment and checking fences and need a rugged bar that survives dust and vibration and provides flood light for close work rather than spot distance there are cheap bars and premium agricultural brands what do farmers recommend" · "I want to get into PC gaming but I also need a laptop for work — can I really get one device that does both reasonably well?" · "I have natural 4C hair and I am trying to retain length but my ends keep breaking off despite deep conditioning what protein treatment would help strengthen my strands"
3.8 Stage 8. Purchase Execution
What shoppers ask. Ready to buy. Study 2: "buy car wax now", "order Dove sensitive body wash bulk", "I need leather conditioner today because my seats are cracking and a buyer sees the car this afternoon, I need a store within three miles", "where online currently has the new Transformers Optimus Prime action figure available". Study 1: "I am ready to buy?", "What is the best deal right now for a midi dress under $60?"
Do the engines show products? Study 1: 93.0% (n = 900), its top stage. Study 2: 43.0% (n = 2,672); Google AI Mode 72.8%, Copilot 55.4%, ChatGPT 37.6%, Perplexity 6.4%. 87.6% of purchase questions get a card somewhere. Confirmed.
Who fills the cards. Shelves narrow to the buyable item: Study 2 2.1 brands per answer (ChatGPT 3.7 products); Study 1 4.7 brands. Study 2: Apple 4% to 5% on ChatGPT and Google AI Mode, then Mainstays (Walmart's label) 4% on ChatGPT, Meguiar's on Google AI Mode, LEGO and Hasbro on Copilot. Merchants: Walmart hosts 14% to 16% of ChatGPT's, Google AI Mode's, and Copilot's cards, Amazon 23% of Copilot's, Home Depot 4% of Google AI Mode's. Study 1: Lulus 29%, Petal & Pup 23%, Old Navy 20%, Fashion Nova 16%, H&M 15%, Express 12%. Confirmed.
Who is cited. The retail stage on every engine. Study 1: 48.1% retail, 23.6% editorial, 15.6% brand-owned (nordstromrack.com, nordstrom.com, summersalt.com, windsorstore.com). Study 2: 48.5% retail, 17.4% editorial, 7.1% brand-owned, 8.2% community; Copilot 59.2% retail and 6.1% editorial; Google AI Mode cites amazon.com for 9.0% of its sources. Reddit drops to 19.8% of Study 2 answers. ChatGPT answers without citing a source 28.9% of the time, and its dated sources are the freshest of any stage (median 98 days). Confirmed.
What the answer looks like. The shortest Study 2 answers (337 words). A retailer is named in 78.6% of Study 2 answers (ChatGPT 82.6%, Google AI Mode 83.8%, Copilot 78.9%) and a price in 60.7% (Study 1 95.8%). Copilot ends 94.5% with a question; ChatGPT commits to one pick in 35.9%.
Rank, price, rating. Study 1 median $66; Study 2 median $68; review counts high (Copilot median 3,280, ChatGPT 578). Within-answer spread 3.2× (Study 2).
Interpretation. Purchase intent is the one stage where citations turn retail on every engine: the answer points at where to buy, and where to buy is the big-box site the engine already indexes. Walmart's private labels surface as brands at purchase and budget stages because the retailer's catalog is in the index. Local-intent purchase questions are where Copilot's map results appear (chapter 5).
Table 8.1. Purchase Execution: measures by study and engine. n answers: Study 1, ChatGPT 900, Study 2, pooled 2,672, Study 2, ChatGPT 668, Study 2, Perplexity 668, Study 2, Google AI Mode 668, Study 2, Copilot 668.
| Measure | Study 1, ChatGPT | Study 2, pooled | Study 2, ChatGPT | Study 2, Perplexity | Study 2, Google AI Mode | Study 2, Copilot |
|---|---|---|---|---|---|---|
| Product-card rate | 93.0% | 43.0% | 37.6% | 6.4% | 72.8% | 55.4% |
| Products per card-bearing answer | 8.0 | 4.8 | 3.7 | 6.4 | 4.4 | 5.7 |
| Distinct brands per card-bearing answer | 4.7 | 2.1 | 2.1 | 1.3 | 1.9 | 2.5 |
| Top-3 brand share of slots | 16.3% | 9.9% | 9.0% | 54.8% | 8.5% | 8.9% |
| Brand HHI | 0.020 | 0.008 | 0.009 | 0.158 | 0.009 | 0.008 |
| Slots on brand-owned store | 44.0% | 8.2% | 16.4% | 11.9% | — | 4.4% |
| Slots on a marketplace | 7.3% | 18.7% | 4.2% | 0.0% | — | 26.9% |
| Top merchant share of slots | 5.0% | 14.2% | 13.8% | 13.0% | 15.2% | 22.9% |
| Sources per answer | 19.5 | 8.0 | 9.4 | 10.3 | 6.3 | 6.0 |
| Answers citing no source | 7.9% | 12.3% | 28.9% | 0.0% | 16.5% | 3.7% |
| Editorial share of sources | 23.6% | 17.4% | 26.0% | 16.9% | 16.1% | 6.1% |
| Retail share of sources | 48.1% | 48.5% | 47.9% | 49.7% | 37.0% | 59.2% |
| Brand-owned share of sources | 15.6% | 7.1% | 7.9% | 5.6% | 11.0% | 4.5% |
| Marketplace share of sources | 7.1% | 8.2% | 2.2% | 3.9% | 11.3% | 21.5% |
| Community share of sources | 1.2% | 8.2% | 5.6% | 8.5% | 18.5% | 0.9% |
| Answers citing reddit.com | 8.7% | 19.8% | 27.4% | 28.3% | 25.1% | 0.6% |
| Words per answer (mean) | 368 | 337 | 339 | 327 | 332 | 349 |
| Hedging phrases per 100 words | 0.33 | 0.78 | 1.07 | 0.88 | 0.53 | 0.63 |
| Asks a clarifying question | 82.2% | 68.5% | 37.4% | 71.7% | 70.2% | 94.5% |
| Names a single pick | 30.6% | 17.8% | 35.9% | 2.4% | 3.1% | 29.8% |
| Names a retailer | 74.1% | 78.6% | 82.6% | 69.0% | 83.8% | 78.9% |
| Quotes a price | 95.8% | 60.7% | 66.6% | 24.1% | 74.3% | 77.7% |
| Card price, median (USD) | $66 | $68 | $55 | $320 | $68 | $60 |
| Cards with a rating | 77.3% | 51.6% | 76.0% | 18.1% | 29.6% | 67.6% |
| Mean rating | 4.48 | 4.54 | 4.49 | 4.75 | 4.56 | 4.55 |
| Review count, median | 34 | 478 | 578 | 0 | 130 | 3,280 |
| Cards with 100+ reviews | 34.7% | 67.1% | 75.1% | 1.1% | 56.7% | 78.6% |
| Rating vs rank, Spearman | -0.17 | -0.02 | -0.03 | — | -0.05 | -0.05 |
Table 8.2. Purchase Execution: brands most often in the cards (share of card-bearing answers that include the brand; Perplexity omitted where fewer than 30 answers carry cards).
| Study, engine | Top brands |
|---|---|
| Study 1, ChatGPT | Lulus 29%; Petal & Pup 23%; Old Navy 20%; Fashion Nova 16%; H&M 15%; Express 12% |
| Study 2, ChatGPT | Apple 4%; Mainstays 4%; Samsung 3%; Ninja 3%; Cuisinart 3%; LEGO 2% |
| Study 2, Google AI Mode | Apple 5%; Samsung 3%; Meguiars 3%; Breville 2%; Google 2%; Cuisinart 2% |
| Study 2, Copilot | Samsung 4%; Apple 4%; LEGO 3%; Hasbro 2%; Sony 2%; Google 2% |
Table 8.3. Purchase Execution: merchants hosting the cards (share of card slots).
| Study, engine | Top merchants |
|---|---|
| Study 1, ChatGPT | Petal & Pup USA 5%; Macy's 5%; Lulus 5%; Walmart 3% |
| Study 2, ChatGPT | Walmart 14%; Target 8%; Best Buy 6%; Walmart.com 3% |
| Study 2, Google AI Mode | Walmart 15%; Target 11%; Best Buy 7%; Home Depot 4% |
| Study 2, Copilot | Amazon.com 23%; Walmart 16%; Target 3%; Best Buy 3% |
Table 8.4. Purchase Execution: most-cited domains (share of cited sources).
| Study, engine | Top cited domains |
|---|---|
| Study 1, ChatGPT | nordstromrack.com 4.6%; nordstrom.com 3.4%; summersalt.com 2.8%; windsorstore.com 2.3%; alibaba.com 1.9%; lulus.com 1.9% |
| Study 2, ChatGPT | reddit.com 4.3%; walmart.com 4.0%; target.com 3.4%; bestbuy.com 3.4%; homedepot.com 2.4%; ulta.com 1.8% |
| Study 2, Google AI Mode | amazon.com 9.0%; youtube.com 6.9%; reddit.com 6.5%; walmart.com 3.8%; target.com 3.1%; bestbuy.com 2.6% |
| Study 2, Copilot | amazon.com 17.2%; walmart.com 11.5%; target.com 4.6%; bestbuy.com 3.6%; ebay.com 1.4%; homedepot.com 1.4% |
| Study 2, Perplexity | reddit.com 4.5%; walmart.com 3.6%; bestbuy.com 3.6%; target.com 3.2%; youtube.com 2.7%; homedepot.com 0.8% |
Example questions, Purchase Execution. Study 1: "I want a linen dress from Guess right now?" · "Quick question. Best place to purchase a summer dress right now? If you had to pick one option, what would it be?" · "Quick question. I am ready to order a work dress. What should I buy today under $250? If you had to pick one option, what would it be?" · "What is the best deal right now for a midi dress under $60?"
Study 2: "want to buy the new Transformers Optimus Prime action figure heard it's hard to find where online currently has it available for purchase and in stock not preorder can ship immediately willing to pay extra for fast delivery" · "I need leather conditioner today because my seats are cracking and a buyer sees the car this afternoon I need a store within three miles with reputable brand moisturizing without greasy residue" · "when is a good time to buy headphones for sales" · "order Dove sensitive body wash bulk"
3.9 Stage 9. Post Purchase
What shoppers ask. Owns it already. Study 2: "Samsung Galaxy S25 tips tricks and hidden features", "I just bought a Dell XPS 15 and I want to add a second storage drive", "water filter slow flow already", "wiring getting hot". Study 1: "How do I wash a long sleeve dress without ruining it?", "How do I make a dress feel less itchy?"
Do the engines show products? Study 1: 2.8% (n = 427). Study 2: 14.7% (n = 1,999); Google AI Mode 36.4%, Copilot 13.8%, ChatGPT 6.4%, Perplexity 2.0%. 57.1% of post-purchase questions get no card on any engine, the highest share of any stage. Home and Toys have no post-purchase questions in Study 2. Confirmed.
Who fills the cards. Accessories and consumables, not the product owned. Study 1's twelve carousels hold Hollywood Fashion Secrets (fashion tape), Sprayway (static spray), CHI. Study 2 ChatGPT: Apple 19%, Anker 9%, Satechi, Belkin, mophie (cables, hubs, chargers); Copilot: Woolite, Zep, Sprayway (cleaning). Walmart is Study 1's top merchant (12%); Best Buy leads ChatGPT's and Google AI Mode's cards (14% to 17%); Amazon 35% of Copilot's. The marketplace share of Study 2 slots peaks here (28%; Copilot 40%). Suggestive (12 card-bearing answers in Study 1, 32 on Study 2's ChatGPT).
Who is cited. Study 1's most editorial stage: 75.1% editorial, 8.6% retail, 2.0% brand-owned (sewingtrip.com, shunvogue.com). Study 2: 46.3% editorial, 23.2% community; Google AI Mode 46.4% community with reddit.com in 76.7% of its answers and youtube.com 16.7% of its sources; engineerfix.com is a top domain for ChatGPT and Copilot. Study 1's oldest sources (median 419 days). Confirmed.
What the answer looks like. No commerce language: a price in 4.0% (Study 1) and 8.1% (Study 2) of answers, a retailer in 3.7% and 11.7%, a single pick in 19.0% and 5.4%. Copilot ends 90.8% with a question.
Rank, price, rating. Cheap accessories: Study 1 median $14, Study 2 $35. Study 1's post-purchase cards carry the highest review counts of any Study 1 stage (median 172): commodity accessories.
Interpretation. Post Purchase is the only stage where Google AI Mode cards more than a third of questions while every other engine is below 14%: its shopping graph treats "my X does Y" as an accessory query. The cards are for other products. For the product itself, this is a support-content and Reddit stage; for accessory and consumable brands it is the one stage where they are the answer to someone else's product.
Table 9.1. Post Purchase: measures by study and engine. n answers: Study 1, ChatGPT 427, Study 2, pooled 1,999, Study 2, ChatGPT 500, Study 2, Perplexity 500, Study 2, Google AI Mode 500, Study 2, Copilot 499.
| Measure | Study 1, ChatGPT | Study 2, pooled | Study 2, ChatGPT | Study 2, Perplexity | Study 2, Google AI Mode | Study 2, Copilot |
|---|---|---|---|---|---|---|
| Product-card rate | 2.8% | 14.7% | 6.4% | 2.0% | 36.4% | 13.8% |
| Products per card-bearing answer | 7.8 | 4.4 | 4.4 | 7.1 | 3.5 | 6.5 |
| Distinct brands per card-bearing answer | 2.2 | 2.5 | 2.5 | 2.3 | 2.0 | 3.6 |
| Top-3 brand share of slots | 50.0% | 13.5% | 19.2% | 44.4% | 18.4% | 11.2% |
| Brand HHI | 0.124 | 0.012 | 0.030 | 0.105 | 0.020 | 0.011 |
| Slots on brand-owned store | 6.5% | 6.2% | 20.2% | 4.2% | — | 3.1% |
| Slots on a marketplace | 17.7% | 28.3% | 0.9% | 0.0% | — | 39.5% |
| Top merchant share of slots | 11.7% | 18.4% | 13.6% | 8.5% | 16.7% | 34.8% |
| Sources per answer | 21.0 | 9.9 | 13.5 | 9.8 | 11.6 | 4.7 |
| Answers citing no source | 0.0% | 7.2% | 4.0% | 0.2% | 21.8% | 2.8% |
| Editorial share of sources | 75.1% | 46.3% | 56.7% | 43.7% | 32.6% | 56.0% |
| Retail share of sources | 8.6% | 10.6% | 13.0% | 9.3% | 6.7% | 16.2% |
| Brand-owned share of sources | 2.0% | 6.1% | 6.9% | 5.0% | 7.0% | 3.8% |
| Marketplace share of sources | 3.5% | 4.3% | 3.7% | 6.1% | 1.3% | 9.3% |
| Community share of sources | 2.6% | 23.2% | 6.7% | 27.3% | 46.4% | 4.8% |
| Answers citing reddit.com | 24.8% | 40.7% | 30.6% | 57.9% | 76.7% | 3.9% |
| Words per answer (mean) | 403 | 383 | 384 | 395 | 391 | 361 |
| Hedging phrases per 100 words | 0.39 | 0.73 | 1.02 | 0.79 | 0.48 | 0.61 |
| Asks a clarifying question | 56.7% | 63.7% | 40.2% | 52.0% | 71.8% | 90.8% |
| Names a single pick | 19.0% | 5.4% | 8.6% | 2.4% | 2.8% | 7.8% |
| Names a retailer | 3.7% | 11.7% | 14.6% | 4.0% | 20.8% | 7.4% |
| Quotes a price | 4.0% | 8.1% | 8.2% | 1.6% | 13.6% | 8.8% |
| Card price, median (USD) | $14 | $35 | $40 | $110 | $50 | $25 |
| Cards with a rating | 71.3% | 43.6% | 61.4% | 29.6% | 28.1% | 62.1% |
| Mean rating | 4.48 | 4.52 | 4.50 | 4.82 | 4.58 | 4.47 |
| Review count, median | 172 | 220 | 167 | 0 | 147 | 1,655 |
| Cards with 100+ reviews | 59.7% | 60.9% | 58.1% | 4.2% | 57.9% | 77.3% |
| Rating vs rank, Spearman | — | 0.07 | — | — | 0.07 | 0.06 |
Table 9.2. Post Purchase: brands most often in the cards (share of card-bearing answers that include the brand; Perplexity omitted where fewer than 30 answers carry cards).
| Study, engine | Top brands |
|---|---|
| Study 1, ChatGPT | Hollywood Fashion Secrets 42%; Sprayway 25%; CHI 17%; The Ordinary 8%; LOFT 8%; Calzedonia 8% |
| Study 2, ChatGPT | Apple 19%; Anker 9%; Satechi 6%; Belkin 6%; mophie 6%; Entronix 6% |
| Study 2, Google AI Mode | Apple 10%; Samsung 8%; Sony 5%; Anker 4%; Satechi 3%; Google 3% |
| Study 2, Copilot | Samsung 7%; Woolite 6%; Zep 6%; Sprayway 6%; JBL 4%; Apple 4% |
Table 9.3. Post Purchase: merchants hosting the cards (share of card slots).
| Study, engine | Top merchants |
|---|---|
| Study 1, ChatGPT | Walmart 12%; Walmart - Static Blok 4%; Etsy 4%; Nordstrom 3% |
| Study 2, ChatGPT | Best Buy 14%; Walmart 7%; See merchants 6%; Target 5% |
| Study 2, Google AI Mode | Best Buy 17%; Walmart 10%; Target 5%; eBay 4% |
| Study 2, Copilot | Amazon.com 35%; Walmart 22%; Target 3%; Best Buy 2% |
Table 9.4. Post Purchase: most-cited domains (share of cited sources).
| Study, engine | Top cited domains |
|---|---|
| Study 1, ChatGPT | alibaba.com 3.4%; shunvogue.com 2.3%; yahoo.com 2.0%; sewingtrip.com 1.7%; reddit.com 1.7%; sewfrenchcrossstitch.com 1.1% |
| Study 2, ChatGPT | reddit.com 5.2%; alibaba.com 3.1%; engineerfix.com 2.9%; healthline.com 1.1%; scienceinsights.org 0.9%; rei.com 0.8% |
| Study 2, Google AI Mode | youtube.com 16.7%; reddit.com 14.9%; facebook.com 5.8%; instagram.com 2.1%; tiktok.com 1.8%; quora.com 1.3% |
| Study 2, Copilot | amazon.com 6.8%; walmart.com 4.0%; youtube.com 2.6%; engineerfix.com 2.4%; alibaba.com 1.5%; reddit.com 0.8% |
| Study 2, Perplexity | youtube.com 11.2%; reddit.com 10.5%; alibaba.com 5.4%; necolebitchie.com 0.8%; apple.com 0.7%; oreateai.com 0.5% |
Example questions, Post Purchase. Study 1: "I am trying to make a smart purchase decision. How do I keep a dress from clinging in the wrong places? I care about value and reliability." · "Quick question. How do I wash a long sleeve dress without ruining it? If you had to pick one option, what would it be?" · "How do I stop a black dress from being gaps at the bust after washing?" · "how do i keep a dress from riding up when i walk?"
Study 2: "tissues not lotion enough" · "I just bought a Dell XPS 15 and I want to add a second storage drive — what are my options and what specs do I need" · "Samsung Galaxy S25 tips tricks and hidden features" · "water filter slow flow already"
4. Cross-Stage Patterns
4.1 Shelf width and concentration
Figure 16. Products per card-bearing answer by stage and engine. Study 1's carousel is a fixed eight-slot strip (8 products in 94.7% of carousels); Study 2's engines show four to seven.
Figure 4. Distinct brands per card-bearing answer by stage and engine. Exploration shelves are the widest; comparison and validation shelves hold about two brands on every engine.
Figure 5. Brand concentration by stage (HHI × 100). Study 1's dress shelf is more concentrated than Study 2's pooled shelf at every stage, and most concentrated at Post Purchase (12 carousels) and Comparison.
Figure 15. Share of card slots on a brand-owned store by stage. Study 1's dress cards sit on brand stores 38% to 50% of the time at every shopping stage; Study 2's ChatGPT cards 10% to 29%, Copilot's 2% to 7%.
Shelf width follows the question's openness, not its commercial intent. The widest shelves are at Category Exploration on every engine; the narrowest at Comparison and Validation, where the engine shows the items being compared or doubted. Concentration rises where shelves narrow. The host of the shelf is a category property more than a stage property: dresses are a direct-to-consumer category, electronics, health, and home are retailer categories, and the stage moves the brand-store share by at most 20 points within either study.
4.2 Who is cited, by stage
Figure 6. Source-type mix by stage, Study 1. Editorial sources dominate the informational stages (65% at Problem Recognition, 75% at Post Purchase); retail peaks at Purchase Execution (48%) and Attribute Constrained (45%); brand-owned sources peak at Attribute Constrained (18%) and Purchase Execution (16%).
Figure 7. Source-type mix by stage, Study 2. The same shape with a community layer of 8% to 23% at every stage, largest at Comparison, Validation, and Post Purchase.
Figure 8. Share of answers citing reddit.com by stage and engine. Google AI Mode cites Reddit in 71% to 79% of problem, comparison, validation, and post-purchase answers; Copilot in under 11% at every stage; Study 1's ChatGPT in 5% to 52%.
The citation mix moves with the stage in the same direction on every engine: editorial and community at the top and bottom of the funnel, retail in the middle and at purchase. The engines differ in level, not in shape. Copilot is the exception on Reddit: it cites community pages for 2% of its sources overall and never more than 11% of its answers at any stage.
4.3 Answer shape
Figure 9. Answer shape by stage, Study 2 pooled: the share of answers that ask a clarifying question, name a single pick, name a retailer, and quote a price.
Figure 10. Hedging phrases per 100 words by stage. Both studies hedge most at Comparison and Validation and least at Attribute Constrained, Budget Framing, and Scenario Confirmation.
Retailer naming and price quoting track the card rate: both peak at Budget Framing and Purchase Execution and fall below 15% at Post Purchase. Hedging tracks the opposite: 1.0 to 1.7 phrases per 100 words at Comparison and Validation against 0.3 to 0.5 at the attribute, budget, and scenario stages. Single-pick language is a ChatGPT habit more than a stage property (chapter 2), but within ChatGPT it peaks at Budget Framing (63%) and troughs at Validation (6%).
4.4 Price, ads, and hosts
Figure 11. Median price of surfaced products by stage and engine. Budget-stage cards are the cheapest on every engine ($21 to $32 in Study 2); comparison and validation cards are the dearest ($100 to $221).
Figure 14. Google AI Mode's ad rate by stage. Ads appear on 1.8% (Post Purchase) to 6.0% (Scenario Confirmation) of its answers; no other engine shows ads at any stage.
The price of what is shown follows the stage: budget questions produce the cheapest shelves and the tightest price spread, comparison and validation questions the dearest flagship products with the heaviest review counts. Google AI Mode's ads cluster at the scenario, attribute, and exploration stages, beside its best organic shelves (chapter 5).
5. Phrasing Style by Stage
Table 5.1. Study 1 (ChatGPT, dresses): carousel rate by stage and phrasing style.
| Intent stage | Short | Medium | Long | Conversational | Messy |
|---|---|---|---|---|---|
| Problem Recognition | 30.8% | 40.1% | 77.5% | 27.7% | 31.0% |
| Category Exploration | 79.9% | 78.6% | 88.1% | 46.1% | 77.8% |
| Budget Framing | 93.2% | 99.6% | 100.0% | 62.5% | 100.0% |
| Attribute Constrained | 100.0% | 98.7% | 99.0% | 25.8% | 98.7% |
| Comparison | 14.6% | 15.1% | 19.4% | 14.7% | 12.2% |
| Validation / Risk Reduction | 4.3% | 4.0% | 23.2% | 10.0% | 2.3% |
| Scenario Confirmation | 90.5% | 87.9% | 98.8% | 51.8% | 91.8% |
| Purchase Execution | 91.7% | 95.5% | 98.5% | 89.0% | 95.8% |
| Post Purchase | 0.0% | 0.0% | 19.7% | 0.0% | 0.0% |
Figure 12. Study 1: carousel rate by stage and style. Conversational phrasing collapses the attribute, scenario, exploration, and budget stages; Long phrasing lifts the problem, validation, and post-purchase stages.
Table 5.2. Study 2, Google AI Mode: product-card rate by stage and phrasing style.
| Intent stage | Short | Medium | Long | Conversational |
|---|---|---|---|---|
| Problem Recognition | 21.8% | 25.4% | 38.9% | 40.0% |
| Category Exploration | 84.1% | 75.9% | 56.9% | 52.8% |
| Budget Framing | 93.6% | 92.0% | 85.6% | 83.2% |
| Attribute Constrained | 92.4% | 90.2% | 78.6% | 83.0% |
| Comparison | 68.6% | 65.8% | 71.5% | 61.0% |
| Validation / Risk Reduction | 48.6% | 50.0% | 59.7% | 58.4% |
| Scenario Confirmation | 85.1% | 74.7% | 72.2% | 66.7% |
| Purchase Execution | 86.5% | 77.6% | 69.4% | 57.1% |
| Post Purchase | 43.2% | 31.2% | 38.4% | 32.8% |
Figure 13. Study 2, Google AI Mode: product-card rate by stage and style. The largest style effect in Study 2 is here, and it is 11 points pooled.
Table 5.3. Study 2, Copilot.
| Intent stage | Short | Medium | Long | Conversational |
|---|---|---|---|---|
| Problem Recognition | 21.2% | 26.6% | 41.9% | 37.9% |
| Category Exploration | 62.4% | 51.8% | 45.6% | 50.6% |
| Budget Framing | 77.6% | 72.8% | 60.8% | 65.6% |
| Attribute Constrained | 51.5% | 48.6% | 51.3% | 50.3% |
| Comparison | 52.9% | 44.3% | 37.7% | 49.1% |
| Validation / Risk Reduction | 35.7% | 31.2% | 34.5% | 42.3% |
| Scenario Confirmation | 51.4% | 46.9% | 31.2% | 42.0% |
| Purchase Execution | 61.8% | 60.0% | 47.1% | 52.8% |
| Post Purchase | 14.4% | 16.9% | 9.6% | 14.4% |
Table 5.4. Study 2, ChatGPT full models only (gpt-5-5 and gpt-5-3, n = 2,190).
| Intent stage | Short | Medium | Long | Conversational |
|---|---|---|---|---|
| Problem Recognition | 26.9% | 26.2% | 50.7% | 53.8% |
| Category Exploration | 88.7% | 88.6% | 75.0% | 66.1% |
| Budget Framing | 100.0% | 100.0% | 98.3% | 95.8% |
| Attribute Constrained | 90.6% | 93.5% | 98.5% | 94.8% |
| Comparison | 78.2% | 77.8% | 79.7% | 71.7% |
| Validation / Risk Reduction | 38.0% | 30.2% | 35.7% | 48.2% |
| Scenario Confirmation | 86.8% | 86.4% | 87.9% | 74.0% |
| Purchase Execution | 92.5% | 80.9% | 84.6% | 69.1% |
| Post Purchase | 19.7% | 7.4% | 15.3% | 12.5% |
Table 5.5. Study 2, Perplexity.
| Intent stage | Short | Medium | Long | Conversational |
|---|---|---|---|---|
| Problem Recognition | 1.2% | 0.6% | 0.0% | 0.5% |
| Category Exploration | 0.0% | 0.0% | 0.6% | 0.6% |
| Budget Framing | 16.0% | 16.0% | 12.8% | 12.0% |
| Attribute Constrained | 10.5% | 12.1% | 13.6% | 10.9% |
| Comparison | 0.0% | 0.6% | 0.0% | 0.6% |
| Validation / Risk Reduction | 0.0% | 0.0% | 0.0% | 2.9% |
| Scenario Confirmation | 10.3% | 9.0% | 10.1% | 8.6% |
| Purchase Execution | 6.5% | 7.3% | 6.5% | 5.5% |
| Post Purchase | 3.2% | 2.4% | 0.8% | 1.6% |
In Study 1, style is the second-strongest predictor after stage (chapter 4: permutation importance 0.086 against 0.224). The effect is concentrated in one style. Conversational phrasing ("Quick question … if you had to pick one option, what would it be?") drops the carousel rate at Attribute Constrained from 99% to 100% down to 25.8%, at Scenario Confirmation from 88% to 99% down to 51.8%, at Category Exploration from 78% to 88% down to 46.1%, and at Budget Framing from 93% to 100% down to 62.5%, yet at Purchase Execution it barely matters (89.0% against 92% to 99%). Long phrasing helps the informational stages: Problem Recognition 77.5% (Long) against 28% to 40% for the other styles, Validation 23.2% against 2% to 10%, and Post Purchase cards only Long questions (19.7%; every other style 0%). Messy phrasing, lowercase with typos, does not hurt (67.9% overall against Short 63.3%). Confirmed.
In Study 2 the style effect is an order of magnitude smaller and engine-specific. Pooled rates are Short 37.9%, Medium 36.1%, Long 34.8%, Conversational 33.7% (about 5,500 answers each). Google AI Mode: Short 69.9% to Conversational 59.2%, driven by Category Exploration (84% to 53%) and Purchase Execution (87% to 57%). Copilot 48.0% to 45.2%. Perplexity flat at 5%. ChatGPT 28.7% to 25.7%; its full models gpt-5-5 66.8% to 62.7% and gpt-5-3 72.1% to 71.2%. Long phrasing again helps Problem Recognition on every engine: ChatGPT 10.6% (Short) to 22.8% (Long), Google AI Mode 21.8% to 38.9%, Copilot 21.2% to 41.9%. No Study 2 cell shows a style switch collapsing a stage the way Study 1's conversational dresses do. Confirmed.
6. Discussion
The stage is the second-largest effect in the study after the engine, and the only one a brand can act on through content and product data. Four implications follow.
The shopping stages are won with product data. Budget, attribute, scenario, and purchase questions produce cards on every engine, and the cards are assembled from product indexes: price, attributes, availability, merchant. Brand-owned stores host 40% to 50% of Study 1's slots at these stages and 10% to 29% of ChatGPT's in Study 2, so a store's own feed is a route onto the shelf in direct-to-consumer categories and a minor one elsewhere, where Walmart, Amazon, Target, and Best Buy host the cards.
The informational stages are won with citations. Problem, comparison, validation, and post-purchase questions are answered in text on most engines, from editorial and community pages. Reddit is cited in 34% to 79% of those answers on three engines. A brand's presence there is measured in mentions, not cards, and chapter 2 shows that cited and carded are different outcomes with different inputs.
The middle of the funnel depends on the engine. A comparison question is a shopping query on Google AI Mode and Copilot and a writing task on ChatGPT and Perplexity. Measurement by stage has to be measurement by stage and engine.
Phrasing matters less than the stage, except on February's ChatGPT. The conversational collapse in Study 1 is reproduced exactly and is real for that engine, that month, and that category. It is not a law of AI shopping: the largest style effect across 22,335 answers on four engines three months later is 11 points.
7. Limitations Specific to This Chapter
- Study 2's stage cells have 199 to 700 answers per engine; Perplexity's card-bearing subsets are small at most stages (1 to 71 answers), so its brand, merchant, price, and rating figures are Suggestive at best and omitted from the tables where under 30.
- Study 1's Post Purchase stage has 427 questions and 12 carousels; its brand and merchant figures are Suggestive.
- Five category × stage cells are absent in Study 2 (Budget Framing and Post Purchase in Home and Toys, Validation in Toys), which shifts the pooled stage rates slightly toward the five complete categories.
- Stage tagging was done at question generation, not by reading the engine's interpretation of the question. A question written as "Comparison" may be read by an engine as a purchase or validation question; the rates here describe the question as asked.
- Example questions are drawn from the data as written, including the generator's occasional artefacts ("between $ and $45").
Navigation. Previous: Study hub · Next: Chapter 2. Four engines, one question · AI Shopping Visibility Study 2026 (hub, abstract, and all chapters).
About the author. Vijaya Kumar Channalli is a serial SaaS founder and the founder of AEOsome (Tartu, Estonia), which helps eCommerce brands get their products recommended when shoppers ask AI what to buy. Read how we write, source and correct posts in our editorial policy.
Sources: AEOsome Research, AI Shopping Visibility Study 2026, chapter 1. Study 1: 8,520 ChatGPT answers, women's dresses, United States, February 28 to March 1, 2026. Study 2: 22,335 de-duplicated answers across ChatGPT, Google AI Mode, Microsoft Copilot, and Perplexity, seven categories, United States, May 5 to May 14, 2026. Hub: https://www.aeosome.com/blog/research/ai-shopping-visibility-study-2026/