Chapter 7. Methodology, Definitions, and Data: How the AI Shopping Visibility Study 2026 Was Built
Chapter 7 of the AI Shopping Visibility Study 2026. The two collections, the de-duplication rule, the product-card definition for each engine, how brands were resolved and cited domains typed, the query and answer features, the statistics and confidence labels, what Study 1 and Study 2 can be compar

AEOsome Research. Vijaya Kumar Channalli. Chapter 7 of the AI Shopping Visibility Study 2026, version 2026-10. The hub carries the abstract, the ten headline findings, and the other chapters. This chapter is the reference for every definition, rule, and limit the other six rely on.
Abstract
The study re-analyzes two collections of AI shopping answers under one code base and one set of definitions. Study 1 holds 8,520 ChatGPT answers to women's-dress questions collected on February 28 and March 1, 2026. Study 2 holds 27,255 answers from ChatGPT, Google AI Mode, Microsoft Copilot, and Perplexity to 5,584 questions across seven categories, collected May 5 to 14, 2026, reduced to 22,335 by keeping one answer per question and engine. This chapter documents the collections, the de-duplication rule and its reconciliation against the original summaries, the product-card definition applied to each engine's response format, the brand resolver and its resolution rates, the domain-type rule set that replaced the engine's own classifier, the 23 tagged query signals and 14 computed query features, the 19 answer-shape features, the statistical methods and the three confidence labels, the comparability of the two studies, ten known limits, and twelve gaps the data cannot close. It ends with the data availability, license, and citation terms.
1. The Two Collections
Table 1. Study design.
| Study 1 | Study 2 | |
|---|---|---|
| Engines | ChatGPT | ChatGPT, Google AI Mode, Microsoft Copilot, Perplexity |
| Category scope | Women's dresses | Electronics, Beauty, Health, Home, Sports, Toys, Auto; five subcategories each |
| Questions | 8,520 (7,841 distinct texts) | 5,584 |
| Answers collected | 8,520 | 27,255 |
| Answers analyzed | 8,520 | 22,335 (one per question and engine; 4,920 retries removed) |
| Collection window | February 28 (2,462 answers) and March 1, 2026 (6,058) | May 5 (Electronics, 3,599 answers), May 11 to 14 (the other six categories) |
| Collection method | Automated capture of ChatGPT's consumer web interface by a third-party collection service, United States, one request per question | Automated capture of each engine's consumer web interface by the same service, batch submission per engine, United States |
| Requested model | gpt-5-mini | not pinned |
| Served models | gpt-5-mini 68.7%, gpt-5-2 31.3% | ChatGPT: gpt-5-3-mini 60.4%, gpt-5-5 30.1%, gpt-5-3 9.1%, unrecorded 0.4% |
| Intent stages | 9 | 9 |
| Phrasing styles | Short, Medium, Long, Conversational, Messy | Short, Medium, Long, Conversational |
| Tagged query signals | 23, on every question | 23, on six categories; none on Electronics |
| Product slots extracted | 40,544 | 56,000 |
| Cited sources extracted | 177,952 from 15,034 domains | 252,153 from 37,610 domains |
Questions in both studies were generated to cover the nine stages of the eCommerce shopping-intent framework in several phrasing styles. Study 1 holds 900 to 1,260 questions per stage except Post Purchase (427). Study 2 holds 2,000 to 2,800 answers per stage on the de-duplicated basis; Home and Toys have no Budget Framing or Post Purchase questions and Toys has no Validation questions, so five of the 63 category-and-stage cells are empty.
Table 2. Study 2 subcategories. Answers on the de-duplicated basis, four engines pooled.
| Category | Subcategories (answers) |
|---|---|
| Electronics | Laptops and computers (1,733), Smartphones (1,707), TVs and displays (1,704), Headphones and audio (1,700), Smart home (1,648) |
| Auto | Exterior accessories, Lighting and electrical, Tires and wheels, Interior accessories, Car care and cleaning (720 each) |
| Beauty | Skincare (722), Haircare (721), Makeup, Fragrance, Personal hygiene (720 each) |
| Health | Vitamins and supplements, First aid and medicine, Cleaning supplies, Paper and household essentials, Air and water purifiers (720 each) |
| Sports | Camping and hiking gear, Cycling and bike accessories, Running and athletic shoes, Yoga and Pilates, Gym equipment and weights (720 each) |
| Home | Air fryers and small appliances (556), Coffee and espresso (552), Cookware and bakeware (540), Bedding and pillows (332), Vacuums and floor care (260) |
| Toys | LEGO and building sets, Board games and puzzles, Action figures and dolls (480 each), Baby and toddler toys (400), Outdoor and sports toys (280) |
Served models. Both collections requested one ChatGPT model and were served more than one. In Study 1 the two served models have the same carousel rate (59.7% and 59.1%), so the mixture does not affect its results. In Study 2 the three served models have card rates of 3.7%, 65.3%, and 72.2%, and routing was by collection day rather than by question (every stage and style received the same mix), so the served model is treated as a variable throughout and every ChatGPT figure in the study is reported by model. gpt-5-3 answered only on May 5 (Electronics), which confounds it with that category; the contrast between gpt-5-3-mini and gpt-5-5, which share collection days and categories, is clean.
2. De-duplication
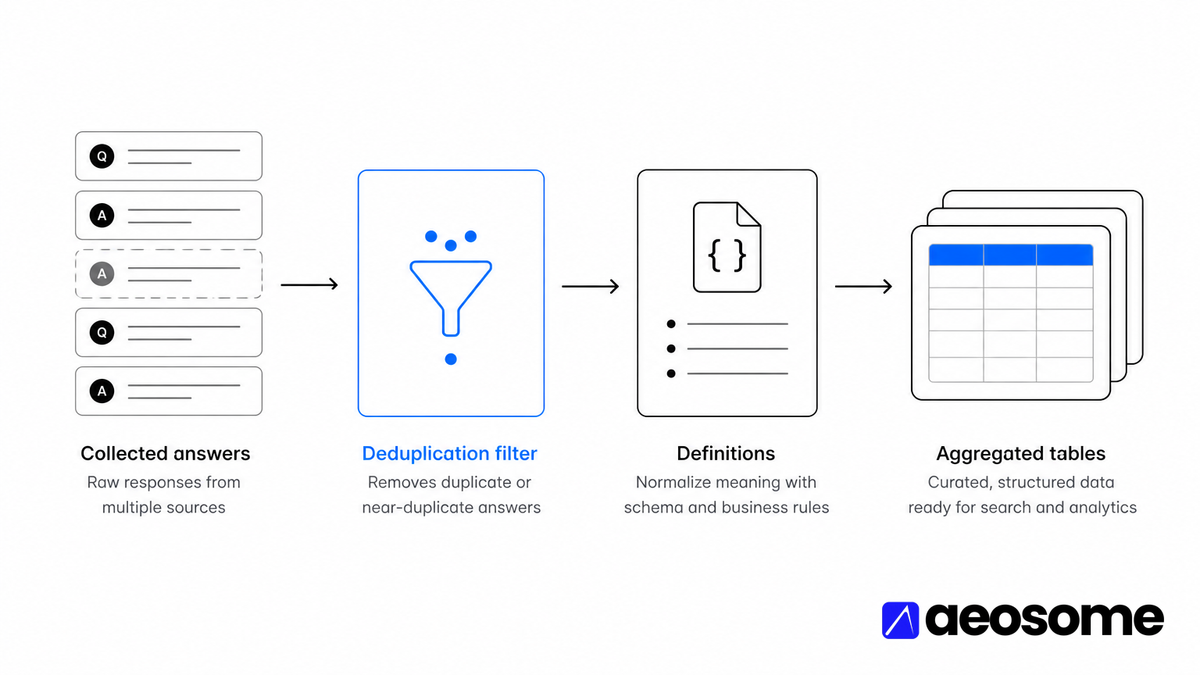
Study 2's collection re-submitted some questions, almost all in Electronics, and stored every attempt. The analysis keeps one answer per (engine, question): the last attempt. This is the rule the original collection summary used, and the re-analysis reproduces that summary exactly.
Table 3. De-duplication reconciliation.
| Item | Value |
|---|---|
| Answers collected | 27,255 in 28 files |
| Answers kept | 22,335 = 5,584 questions × 4 engines, less one (Copilot lacks one Electronics question) |
| Retries removed | 4,920: Electronics 4,893, Home 24, Beauty 3 |
| Retry groups | 3,519 (2,118 of two attempts, 1,401 of three) |
| Removed per engine | ChatGPT 1,238; Google AI Mode 1,229; Copilot 1,231; Perplexity 1,222 |
| Kept answers not completed | 30 (ChatGPT 22, Perplexity 3, Google AI Mode 3, Copilot 2); counted as "no card" |
| Questions with inconsistent text across attempts | 4 |
| Reconciled against the collection summary | overall card rate 35.6% (7,955 of 22,335); every engine, category, and stage rate; exact |
The removed retries are not discarded. They are the basis of the stability analysis in chapter 5, which compares the first and last attempt of each retry group. Every other Study 2 rate in the study is on the 22,335-answer basis. Rates on the 27,255 collected answers are never published; where one appeared in an earlier article, chapter 6 corrects it.
Study 1 has no retries at the question level (8,520 distinct question identifiers), but 679 of its questions repeat another question's text, which gives 1,286 pairs of identical questions and a second stability test.
3. The Product-Card Definition
An answer "shows a product card" when the engine's structured response contains at least one product object. A product mentioned in the text does not count. The rule is the one the original Study 2 collection used, applied identically to Study 1.
Table 4. Product surfaces by engine.
| Engine | Structured product fields counted | Other surfaces recorded |
|---|---|---|
| ChatGPT (Study 1) | products list in the normalized response; "carousel triggered" is equivalent to one or more products | sources, citation pills, entities, map |
| ChatGPT (Study 2) | inline products; shopping-card products | ads, map, citation pills, entities |
| Google AI Mode | inline products; shopping cards | ads, places, videos |
| Copilot | shopping-card products | map |
| Perplexity | shopping-card products | places, videos, images, related queries, the engine's own search sub-queries |
Each product object yields one slot with, where the engine provides them, title, price, rating, review count, merchant, and link. Google AI Mode's links are search redirects, so its merchant is known only from the store name and its host domain is unknown. "Shelf", "carousel", "card strip", and "product card" are used interchangeably in the chapters; "carousel" is Study 1's name for ChatGPT's eight-slot strip.
4. Brand Resolution
The engines' own brand fields are unreliable: Study 1's is the first word of the product title, so "Old Navy" becomes "Old"; Copilot carries a brand field on about one slot in eight, ChatGPT's offer data on one in ten, and Google AI Mode and Perplexity carry none. One resolver was written for both studies and applied to all 96,503 slots (56,000 in Study 2, 40,544 in Study 1, including retries). It tries five methods in order and records which one fired and a confidence level.
Table 5. Brand resolution methods, share of slots.
| Method | What it does | Study 1 | S2 ChatGPT | S2 Copilot | S2 Google AI Mode | S2 Perplexity |
|---|---|---|---|---|---|---|
| Domain match | the product's host domain is a known brand store (lulus.com, samsung.com) | 48.4% | 25.7% | 21.2% | 25.3% | 23.3% |
| Explicit field | the engine's own brand field, where present | 0.9% | 34.6% | 38.8% | 33.9% | 14.8% |
| Curated list | a maintained list of multi-word brand names matched against the title | 22.4% | 8.7% | 8.7% | 13.4% | 12.2% |
| Engine brand field | the engine's brand field for Copilot and ChatGPT offers | 0% | 10.2% | 11.6% | 0% | 0% |
| Dash pattern | "Brand - Product" title patterns | 0.6% | 0.5% | 1.0% | 0.2% | 2.0% |
| First word, low confidence | fallback; excluded from concentration tables | 18.8% | 16.8% | 14.7% | 23.2% | 33.8% |
| Unresolved | no brand assigned | 8.9% | 3.5% | 3.9% | 4.0% | 13.9% |
| Resolved at high confidence | 71.8% | 79.3% | 80.4% | 72.6% | 50.3% |
Sub-brands roll up to the parent (Samsung Galaxy to Samsung, Google Nest to Google). The lexicon of 1,200 brands and its matching counts are a published table. Perplexity's low resolution reflects its merchant network of small stores whose titles do not carry a recognizable brand. Per-brand counts in the chapters use all resolved slots; concentration measures (HHI, Gini, top-k shares) exclude the first-word fallback.
5. Source Typing
Each cited source has a URL, a title, a position in the engine's list, and, for ChatGPT only, a publication date. The registrable domain of every cited source was typed with one rule set, replacing the engine's own classifier, which had typed 14,898 of Study 1's 15,034 domains as Retail. The 300 most-cited domains were reviewed by hand and the rules adjusted until they agreed.
Table 6. Domain types.
| Type | Definition | Domains | Example rules |
|---|---|---|---|
| Editorial | publishers, review sites, blogs, listicle sites | 26,827 | path patterns for articles and guides; publisher labels; known review sites |
| Retail | multi-brand retailers, and any other domain that hosts product cards or product-page URLs | 13,150 | known retailer hosts; product-page path patterns, strict and loose |
| Brand-owned | a store whose cards carry its own brand, or a manufacturer's domain | 1,430 | match between the domain and the resolved brand of the products it hosts |
| Marketplace | Amazon, eBay, Etsy, Alibaba, Newegg, Wayfair, Poshmark, and similar | 149 | list |
| Community | Reddit, YouTube, forums, social networks | 871 | list |
| Other | reference and government sites, support pages, aggregators, unknown | 8,553 | reference list; organization domains; fallback |
Table 7. Citations by source type and engine. Share of cited sources; Study 2 on the de-duplicated basis.
| Engine | Sources | Editorial | Retail | Brand-owned | Marketplace | Community | Other |
|---|---|---|---|---|---|---|---|
| ChatGPT, Study 1 | 177,952 | 46.0% | 26.7% | 10.3% | 7.0% | 3.2% | 6.7% |
| ChatGPT, Study 2 | 77,871 | 52.5% | 18.4% | 5.6% | 2.2% | 10.5% | 10.7% |
| Google AI Mode | 63,612 | 37.5% | 11.4% | 7.1% | 2.9% | 34.7% | 6.5% |
| Copilot | 40,741 | 35.7% | 36.0% | 3.6% | 15.4% | 2.0% | 7.3% |
| Perplexity | 69,929 | 44.2% | 19.9% | 4.3% | 4.2% | 19.1% | 8.3% |
The same rule set types the host domain of every product slot, which is how the chapters separate brand-owned, retailer, and marketplace hosting of cards. Study 1's engine taxonomy is kept in the research folder as the record of the discrepancy and is not used.
6. Query Features
Two feature sets describe the questions.
Tagged signals. The question generator tagged 23 signals on each question: brand mentioned, price mentioned and a price cap, deal-seeking, urgency, explicit purchase, use case, comparison, problem, conversational tone, attribute count, ambiguity score, product specificity, and others. All 8,520 Study 1 questions carry them; in Study 2 they are present for six categories and absent for Electronics (894 questions, 3,599 answers), so every signal analysis in Study 2 uses the 18,736 tagged answers. In Study 1 four signals are constant (typo, local intent, model name, SKU all zero; specificity always "Generic") and are not analyzed.
Computed features. To cover every question in both studies with one definition, 14 features were computed from the question text by the study's own code: token count, character count, a question mark, a wh-word opening, and the presence of price, compare, deal, urgency, buy, "best", problem, and use-case words, all-lowercase phrasing, missing end punctuation, and dollar amounts. These are the "wording features" in chapter 4.
Table 8. Feature coverage.
| Feature set | Count | Study 1 | Study 2 |
|---|---|---|---|
| Intent stage, phrasing style | 2 | all | all |
| Tagged signals | 23 | all (four constant) | six categories, 18,736 answers |
| Computed wording features | 14 | all | all |
| Served model | 1 | all | ChatGPT only |
7. Answer-Shape Features
Nineteen features were computed from each answer's text: characters, words, sentences, bullets, headers, table rows, bold spans, links, hedging phrases ("it depends", "may vary", "generally", and similar) per 100 words, whether the answer asks a clarifying question, whether it ends with a question, whether it names a single recommendation, whether it names a retailer, dollar mentions and the minimum and maximum price in the text, and question-mark count. Markdown structure (bullets, headers, tables) is available for Study 2 only; Study 1 stored plain text. ChatGPT also returns a list of named product entities, used in the text-against-cards comparison in chapter 5.
8. Statistics and Confidence Labels
Rates and intervals. Every rate is a share of answers (or slots) in a defined cell. Headline rates carry a 95% confidence interval: Wilson intervals for simple proportions and bootstrap intervals (1,000 resamples) for the published platform, stage, and category rates. The platform rates have half-widths near 1.2 points, Study 2 stage rates 1.6 to 2.0 points, and Study 1 stage rates 1.6 to 3.1 points; the intervals are listed in the hub's Appendix A.
Multiple comparisons. The 36 pairwise stage differences in Study 2 were tested with a Bonferroni correction at a family-wise 0.05; 31 survive. The five that do not are adjacent stages within four points and the chapters never call them differences. Every platform and category difference survives.
Models. Chapter 4 fits a logistic regression (odds ratios with intervals) and a gradient-boosted classifier (predictive power, permutation importance) for three targets, evaluated with five-fold cross-validation. Study 2 folds are grouped by question so the same question never appears on both sides of a split; rank-one models are grouped by carousel. Permutation importance is the out-of-sample AUC lost when a feature's values are shuffled, averaged over five repeats.
Overlap and concentration. Jaccard overlap between two sets is the size of their intersection over the size of their union. HHI is the sum of squared brand shares of slots (0 for many equal brands, 1 for one brand); Gini measures inequality of brand slot counts; top-k share is the share of slots held by the k largest brands.
Table 9. Confidence labels used in every chapter.
| Label | Rule |
|---|---|
| Confirmed | Computed on the full relevant set with at least 200 answers per cell and a difference well outside its 95% interval; or reproduced in both studies with the same direction. |
| Suggestive | Between 30 and 200 answers per cell, or a comparison with a known confound (collection day, served model, category mix). |
| Hypothesis | A mechanism proposed to explain a confirmed pattern that the data cannot test, or a pattern seen only in a small cell. |
Cells below 60 answers are never called Confirmed. Where a difference lies inside its interval the text says so.
9. What Study 1 and Study 2 Can Be Compared On
The two studies share definitions and code, so these are comparable: whether an answer carries a card; products per answer; the brand, merchant, and host mix of the cards; the source-type mix of citations; answer shape; the price, rating, and review profile of surfaced products; the 14 computed wording features; and stage and style effects within each study.
The level of any rate is not comparable. Study 1 is one category in February in one collection run with two served models; Study 2's ChatGPT is seven other categories in May with three served models, 60% of its answers from a small model that rarely shows cards. Study 1's 59.5% carousel rate against Study 2 ChatGPT's 28.5% is a difference between two snapshots, not a trend. Restricted to its two full models, Study 2 ChatGPT's card rate is 66.9%, within eight points of Study 1. Chapter 2 compares the two ChatGPT snapshots metric by metric on the full-model subset as well as the whole.
10. Known Limits
- Every Study 2 engine comparison uses the de-duplicated set, and the 30 incomplete answers count as "no card".
- Tagged signals are absent for Electronics; signal analyses in Study 2 cover 18,736 answers and exclude the category with the highest card rate.
- Study 1's engine brand field and domain classifier were discarded; published figures that relied on them are corrected in chapter 6.
- ChatGPT's served model is a confound in Study 2 and is reported as a variable; gpt-5-3 is confounded with the Electronics collection day.
- Study 2 records batch queue time (median 2.3 hours), not response latency; Study 1 records request time (median 35 to 45 seconds). Speed is not compared.
- Google AI Mode's product links are redirects, so its card hosts are unknown and it is excluded from host-domain measures.
- Perplexity's cards include stores outside the United States, about one slot in twelve, with prices printed in dollars that are not dollars. Its price figures use medians and are flagged wherever they appear.
- Source publication dates exist only for ChatGPT, on 57% of its sources. Freshness is a ChatGPT-only analysis.
- No page content was stored for cited sources; comparisons of what a source says against what the answer says use source titles only.
- All answers are United States, English, logged out, and captured from the engines' consumer web interfaces by an automated collection service; no engine's developer API was used. Personalization, location, and mobile surfaces are unobserved.
11. What the Data Cannot Answer
Table 10. Twelve gaps and what would close them.
| # | Gap | Consequence | What would close it |
|---|---|---|---|
| 1 | No content stored for cited pages | Source-against-answer comparisons are limited to titles | A crawl of the most-cited URLs per engine, stored beside the answer |
| 2 | No tagged signals for Electronics | Signal analyses exclude the highest-card category | Run the tagger over the Electronics questions (a query-side step) |
| 3 | ChatGPT's served model was not controlled | Any ChatGPT trend claim is unsafe without the model | Record the served model on every run; pin it where the collection service allows |
| 4 | Five empty category-and-stage cells | Home and Toys cannot be compared at the budget and post-purchase stages; Toys not at validation | About 400 questions per missing cell |
| 5 | No repeat of Study 1, one engine | Every fashion-against-other comparison is two snapshots | Re-run 1,000 Study 1 questions on all four engines in the same week as the next collection |
| 6 | No eligibility ground truth | The study sees what was shown, not what was eligible and not chosen; feed, schema, and crawl gates are untestable | Join surfaced product URLs to a crawl of merchant pages for the largest hosts |
| 7 | No Google organic rank data | "Rankings do not transfer" cannot be tested here | One SERP run for the 5,584 questions, joined to cited domains |
| 8 | Perplexity's foreign stores and currencies | Perplexity price statistics are unreliable | Store the card's country or currency where the captured page exposes it; otherwise filter by domain suffix as done here |
| 9 | Dates only on ChatGPT sources | Freshness is one engine | Resolve dates for the most-cited URLs through the crawl in gap 1 |
| 10 | No per-request latency or cost in Study 2 | Engine speed cannot be compared | Log timestamps at the request level |
| 11 | One country, logged out, desktop-style web interface | Personalization, location, and mobile are unobserved | Out of scope for the collection method; stated in every chapter |
| 12 | Entities only on ChatGPT; markdown only in Study 2 | Text-against-card analysis is ChatGPT-centric; Study 1's shape features are weaker | Keep both fields in future runs |
12. Data Availability, License, and Citation
Availability. The study will publish its aggregated tables as a downloadable package under a Creative Commons Attribution 4.0 license (CC BY 4.0): rates by stage, engine, and category with intervals; engine agreement and overlap; category and subcategory profiles; the leading brands and cited domains by stage; the model summaries; and a column glossary. The package will never include question texts, answer texts, individual product URLs, or any per-answer row. Until the package is released, the tables behind any figure in the study are available on request through the contact on the AEOsome site. The research folder that produced the study holds 130 tables, 15 scripts, and 19 figures; the scripts run in order from the raw collections and were used for every number on these pages.
Versioning. This is version 2026-10. A re-collection or a recut produces a new version with a changelog in chapter 6. Numbers on earlier AEOsome articles were brought into line with this version in October 2026, with a dated note on each.
Citation. AEOsome Research (2026). AI Shopping Visibility Study 2026: How four AI engines answer 30,855 shopping questions. Version 2026-10. https://www.aeosome.com/blog/research/ai-shopping-visibility-study-2026/
Quote any figure with its study label, its basis, and, for ChatGPT, its served model, as shown on the page. Figures and tables may be reproduced with a link to the hub.
13. Glossary
Table 11. Terms.
| Term | Meaning |
|---|---|
| Product card, carousel, shelf, card strip | A structured product object in the answer (title, price, merchant link). "Carousel" is Study 1's name for ChatGPT's eight-slot strip. |
| Slot | One product object; the unit for brand, merchant, price, rating, and review analyses. |
| De-duplicated set | Study 2's 22,335 answers, one per engine and question, last attempt kept. |
| Collected answers | Study 2's 27,255 answers including retries; used only for the stability analysis. |
| Served model | The model name the engine returned with the answer, as opposed to the model requested. |
| Stage, intent | One of the nine shopping intents of the AEOsome framework. |
| Style | Short, Medium, Long, Conversational, and (Study 1 only) Messy phrasing. |
| Tagged signals | The 23 query features produced by the question generator's tagger. |
| Wording features | The 14 query features computed by the study's code on every question. |
| Source type | Editorial, Retail, Brand-owned, Marketplace, Community, or Other, assigned per cited domain by the study's rule set. |
| Host domain | The domain a product card links to; typed with the same rule set. |
| HHI, Gini, top-k share | Concentration of slots among brands; see section 8. |
| Jaccard | Overlap between two sets: intersection over union. |
| AUC | Area under the ROC curve on held-out data; 0.5 is chance, 1.0 is perfect. |
| Permutation importance | Out-of-sample AUC lost when one feature's values are shuffled. |
| Wilson interval, bootstrap interval | 95% confidence intervals for a rate. |
| Confirmed, Suggestive, Hypothesis | The confidence labels defined in Table 9. |
Table 12. The nine intent stages.
| # | Stage | Example question shape |
|---|---|---|
| 1 | Problem Recognition | "My dresses always wrinkle in photos. What should I look for?" |
| 2 | Category Exploration | "What kinds of air purifiers are there for a small apartment?" |
| 3 | Budget Framing | "Best running shoes under $100?" |
| 4 | Attribute Constrained | "A midi dress with pockets, machine washable, in linen." |
| 5 | Comparison | "Sony WH-1000XM5 or Bose QC Ultra for flights?" |
| 6 | Validation / Risk Reduction | "Is this creatine brand safe to take daily?" |
| 7 | Scenario Confirmation | "Which tent works for a rainy weekend with two kids?" |
| 8 | Purchase Execution | "Where can I buy the Ninja air fryer today?" |
| 9 | Post Purchase | "My new vacuum loses suction after a week. What now?" |
Navigation. Previous: Chapter 6. Corrections and changes · Next: Study hub · AI Shopping Visibility Study 2026 (hub, abstract, and all chapters).
About the author. Vijaya Kumar Channalli is a serial SaaS founder and the founder of AEOsome (Tartu, Estonia), which helps eCommerce brands get their products recommended when shoppers ask AI what to buy. Read how we write, source and correct posts in our editorial policy.
Sources: AEOsome Research, AI Shopping Visibility Study 2026, chapter 7. Study 1: 8,520 ChatGPT answers, women's dresses, United States, February 28 to March 1, 2026. Study 2: 22,335 de-duplicated answers across ChatGPT, Google AI Mode, Microsoft Copilot, and Perplexity, seven categories, United States, May 5 to May 14, 2026. Hub: https://www.aeosome.com/blog/research/ai-shopping-visibility-study-2026/