AI Shopping Visibility Study 2026: How Four AI Engines Answer 30,855 Shopping Questions
A research study of 30,855 AI shopping answers on ChatGPT, Google AI Mode, Microsoft Copilot and Perplexity: when product cards appear, which brands fill them, who gets cited, and what predicts it. Ten findings, 14 figures, seven chapters.

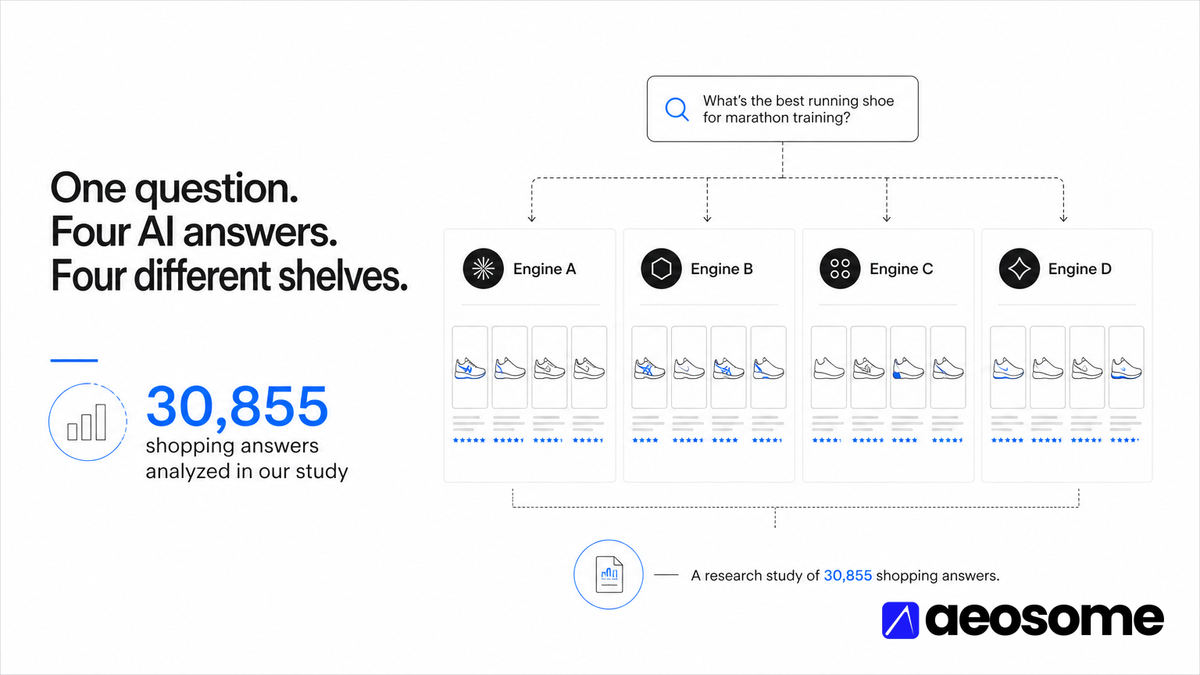
AEOsome Research. Vijaya Kumar Channalli. Version 2026-10, published October 2026. This page is the front matter of the study: abstract, key findings, methods summary, headline results, limitations, and a guide to the seven chapters that carry the full evidence.
Abstract
We measured what four AI answer engines return when a shopper asks a shopping question. Study 1 sent 8,520 questions about women's dresses to ChatGPT in February 2026. Study 2 sent 5,584 questions across seven product categories to ChatGPT, Google AI Mode, Microsoft Copilot, and Perplexity in May 2026, yielding 22,335 de-duplicated answers. Each question was tagged with one of nine shopping intents and one of up to five phrasing styles. From every answer we extracted product cards, the brands and merchants in them, the sources cited, and the shape of the text.
The engine decides whether products appear more than the question does. Google AI Mode shows a product card on 64.4% of queries, Copilot on 44.5%, ChatGPT on 28.5%, and Perplexity on 5.0%. Only 1.6% of queries receive a card on all four engines, and where two engines both show cards they share 1% to 5% of the same products. ChatGPT's rate is a mixture: 3.7% on the mini model that served 60% of its answers, and 65% to 72% on its full models. Intent is the second-largest effect: price-capped questions get cards 54.8% of the time, post-purchase questions 14.7%. Each engine cites a different web, with Google AI Mode drawing 35% of its sources from Reddit, YouTube, and other community sites, Copilot drawing 51% from retailers and marketplaces, and ChatGPT drawing 50% from editorial sites. Inside a carousel, rating and review count predict the first position; across brands, rating does not predict presence. Every result carries its sample size and a confidence label, and the two studies are compared only where their definitions match.
1. Key Findings
Each finding states its number, its study, and its confidence label as defined in section 3.5. The figure or table that carries the evidence is named in brackets.
Finding 1. The platform decides whether products appear, more than the question does. Google AI Mode shows a product card on 64.4% of shopping queries, Copilot on 44.5%, ChatGPT on 28.5%, and Perplexity on 5.0% (Study 2, n = 22,335). The platform spread is 59 points; the spread across the nine intents is 40 points; across the seven categories, 22 points. In a model predicting whether a card appears, the platform alone (AUC 0.761) outperforms intent, category, style, and wording combined (AUC 0.685). Confirmed. [Figure 1, Tables 2a and 2b, Table 10]
Finding 2. The same question gets a different shelf on every engine. Of 5,583 questions asked on all four engines, 1.6% received a product card on all four and 21.9% on none. The most common outcome is a card on exactly one engine (31.7%). Where two engines both show cards, the sets of brands overlap by a Jaccard index of 0.25 to 0.42 and the sets of products by 0.01 to 0.05; the cited domains overlap by 0.06 to 0.12. Confirmed. [Figures 2 to 4, Table 7]
Finding 3. ChatGPT's product surface depends on which model served the answer. In Study 2, 60% of ChatGPT's answers came from gpt-5-3-mini, which showed a card 3.7% of the time (95% CI 3.1 to 4.4). The full models showed one 65.3% (gpt-5-5) and 72.2% (gpt-5-3) of the time. Routing varied by collection day, not by query: every intent and style received the same mix. On the full models, the stage profile matches Study 1 at the top of the funnel and exceeds it at the comparison and validation stages. Confirmed. [Figure 5, Table 5, Table 6]
Finding 4. Intent stage is the second-largest effect and its order is similar across engines at the extremes. Budget Framing leads on every engine (Study 2 pooled 54.8%; Google AI Mode 88.6%, Copilot 69.2%, ChatGPT 47.0%, Perplexity 14.2%); Post Purchase trails everywhere (14.7% pooled). Thirty-one of the 36 pairwise stage differences in Study 2 survive a Bonferroni correction. Comparison and validation questions sit in the middle in Study 2 (35.7%, 26.2%) but near zero in Study 1 (15.3%, 8.3%), because Google AI Mode and Copilot treat "X vs Y" as a shopping query and ChatGPT largely does not. Confirmed. [Figure 7, Tables 2a and 2b]
Finding 5. Each engine cites a different web. Google AI Mode's shopping sources are 35.1% community content (YouTube 13.0%, Reddit 12.1%, plus Facebook, Instagram, TikTok, and Quora, which no other engine cites); Reddit appears in 51.8% of its answers. Copilot's sources are 36.5% retail and 15.0% marketplace, with amazon.com alone at 12.4%. ChatGPT's are 49.9% editorial, and 14.5% of its answers cite no source at all. Perplexity rewrites 85% of questions into a search of about four words and adds "best" to 18.7% of them. Confirmed. [Figure 6, Tables 3a and 3b]
Finding 6. Study 1's citations were not "89 to 99% retail". The method used in earlier reporting labeled 14,898 of 15,034 cited domains as retail. Re-typed with one rule set applied to both studies, Study 1's 177,952 citations are 46.0% editorial, 26.7% retail, 10.3% brand-owned, 7.0% marketplace, 3.2% community, and 6.7% other. Retail ranges from 8.6% at Post Purchase to 48.1% at Purchase Execution. Confirmed; this corrects a published figure (chapter 6). [Table 4, chapter 1]
Finding 7. Rating and review count predict position inside a carousel, not presence across carousels. Inside ChatGPT's eight-slot carousel in Study 1, one within-carousel standard deviation of rating doubles the odds of rank one (odds ratio 2.1), review count multiplies them by 1.7, and price by 1.4, in the direction of the pricier product. The most-reviewed product leads 33.1% of the time, the cheapest 9.4%. Across 110 brands with at least 50 slots, average rating is negatively correlated with the number of carousels a brand appears in (Spearman −0.24). On Copilot, rating, price, and review count together predict rank one no better than chance (AUC 0.555). Confirmed. [Figure 10, Figure 11]
Finding 8. Re-asking the same question changes the shelf. Study 2's 3,519 retry pairs agree on card versus no card 89.8% of the time on Google AI Mode, 86.4% on Perplexity, 75.4% on Copilot, and 57.6% on ChatGPT. ChatGPT's figure splits by model: 90.2% agreement when the same model answered both times, 25.5% when the model switched. Where both attempts showed cards, brand overlap was 0.44 to 0.77 and product overlap 0.06 to 0.70. In Study 1, 1,286 pairs of identical question texts agreed on card versus no card 96.0% of the time and shared 25% of brands and 6% of products. Confirmed. [Figure 9, Table 8]
Finding 9. Perplexity's shelf is a different merchant network, and Copilot's is Amazon and Walmart. Perplexity shows cards on 30.3% of electronics queries and on 0.3% or fewer in every other category. 99.3% of its card links are Shopify-style store URLs, 828 merchants fill 1,842 slots, 83.0% of its products carry zero reviews, and 8.6% of its slots sit on non-US domains with prices labeled in dollars. Copilot's cards are 25.2% Amazon and 18.2% Walmart with a median of 2,189 reviews per product. ChatGPT and Google AI Mode both lead with Walmart (about 11% of slots). Confirmed. [Figure 12, Table 3b]
Finding 10. Intent and phrasing explain what the engine-tagged query signals explain. In Study 1, a model using intent, style, and 14 simple wording features predicts a carousel with AUC 0.947; adding 23 engine-tagged signals such as "deal-seeking" and "urgency" gives 0.943. Conversational phrasing collapsed the attribute-constrained stage on ChatGPT in February 2026 from 99% to 25.8%; the largest style effect anywhere in Study 2 is 11 points (Google AI Mode, Short 69.9% to Conversational 59.2%). Long phrasing roughly doubles the card rate for problem-stage questions on every engine. Confirmed. [Figures 13 and 14, Table 10]
2. Research Questions
The study was designed to answer five questions that an eCommerce brand cannot answer from its own analytics, because the AI answer happens before any click.
- At which stage of a shopping journey does an AI engine show products rather than text, and does the answer differ by engine?
- When products are shown, which brands, merchants, and hosts fill the slots, and how concentrated is that set?
- Which pages do the engines cite, and how does the mix of editorial, retail, brand-owned, marketplace, and community sources change by engine and stage?
- How much of the outcome is explained by the platform, the intent, the category, the phrasing, and, on ChatGPT, the model that served the answer?
- How stable is any single answer, and what does that imply for measuring AI visibility?
3. Materials and Methods
3.1 Studies and samples
Table 1. Study design.
| Study 1 | Study 2 | |
|---|---|---|
| Engines | ChatGPT | ChatGPT, Google AI Mode, Microsoft Copilot, Perplexity |
| Category scope | Women's dresses | Electronics, Beauty, Health, Home, Sports, Toys, Auto; five subcategories each |
| Questions | 8,520 | 5,584 |
| Answers analyzed | 8,520 | 22,335 (27,255 collected; 4,920 duplicate retries removed) |
| Collection window | February 28 to March 1, 2026 | May 5 to May 14, 2026 |
| Served models | gpt-5-mini 68.7%, gpt-5-2 31.3% | ChatGPT: gpt-5-3-mini 60.4%, gpt-5-5 30.1%, gpt-5-3 9.1% |
| Intent stages | 9 | 9 |
| Phrasing styles | Short, Medium, Long, Conversational, Messy | Short, Medium, Long, Conversational |
| Market, language | United States, English | United States, English |
| Product slots extracted | 40,544 | 56,000 |
| Cited sources extracted | 177,952 from 15,034 domains | 252,153 from 37,610 domains |
Questions were generated to cover the nine intents of the eCommerce shopping-intent framework: Problem Recognition, Category Exploration, Budget Framing, Attribute Constrained, Comparison, Validation / Risk Reduction, Scenario Confirmation, Purchase Execution, and Post Purchase. Study 2 has no Budget Framing or Post Purchase questions in Home and Toys, and no Validation questions in Toys; those cells are reported as absent, not zero.
3.2 Definitions
Product card. A structured product object in the answer with a name, a price, and a merchant link, rendered by the engine as a card or carousel. On ChatGPT this means inline products or shopping cards; on Google AI Mode, inline products or shopping cards; on Perplexity, shopping cards; on Copilot, shopping cards. A brand named in a sentence does not count. "Product-card rate" is the share of answers with at least one such object.
Brand. Resolved from the product title with one resolver applied to both studies: a title prefix that matches the merchant domain, an explicit brand field where the engine provides one, a curated list of multi-word brands, and a first-word fallback that is flagged low-confidence and excluded from concentration measures. Sub-brands roll up to their parent. Resolution rates: Study 1 95%; Study 2 ChatGPT 97%, Google AI Mode 97%, Copilot 96%, Perplexity 86%.
Source type. Every cited domain was typed with one rule set: community (Reddit, YouTube, forums, social networks), marketplace (Amazon, eBay, Etsy, Alibaba, Newegg, Wayfair, and similar), brand-owned (a store whose cards carry its own brand, or a manufacturer domain), retail (multi-brand retailers and other product-hosting domains), editorial (publishers, review sites, blogs, listicle sites), and other (reference, government, support pages, aggregators, unknown). The unknown residue is 5.3% of Study 1 citations and 5.5% of Study 2 citations.
Served model. The model name the engine returned with the answer, as distinct from the model requested. Recorded for ChatGPT in both studies.
3.3 De-duplication
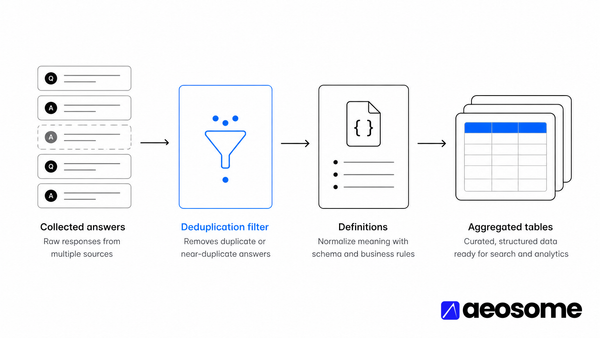
Study 2 collected 27,255 answers, of which 4,920 were repeat attempts of the same question on the same engine, almost all in Electronics. One answer per (engine, question) was kept, the last attempt. Every Study 2 rate on these pages is computed on the 22,335 de-duplicated answers. The 4,920 repeats are used only as a consistency test (Finding 8). Thirty of the 22,335 answers failed and count as "no card".
3.4 Extraction
Product cards, brands, merchants, hosts, prices, ratings, review counts, cited sources, and answer-text features were extracted from the raw engine responses with one code base for both studies. Answer-text features include length, bullets and headings, hedging phrases, clarifying questions, single-recommendation language, retailer mentions, and price mentions. Fourteen wording features of the question were computed identically on both studies so that query effects are comparable; Study 2's 23 engine-tagged query signals exist for six of its seven categories (not Electronics).
3.5 Statistics and confidence labels
Rates carry 95% Wilson intervals; headline rates also carry bootstrap intervals (Appendix A). Stage differences in Study 2 were tested pairwise with a two-proportion z-test and a Bonferroni correction over 36 pairs. Predictive models are logistic regressions and gradient-boosted classifiers evaluated out of sample, with folds grouped by question in Study 2 so that the same question never appears in both training and test sets. Feature importance is permutation importance, the AUC lost when one feature is shuffled.
Table 9. Confidence labels used throughout the study.
| Label | Meaning |
|---|---|
| Confirmed | Computed on the full relevant set with at least 200 answers per cell, and a difference well outside its 95% interval |
| Suggestive | Between 30 and 200 answers per cell, or a comparison that is confounded |
| Hypothesis | A pattern seen in a small cell or inferred, not tested |
3.6 What can and cannot be compared across the two studies
Comparable, because the definitions and code are identical: product-card presence, products per answer, brand and merchant mix, source-type mix, answer shape, and the price, rating, and review profile of surfaced products. Not comparable as a trend: the level of any rate. Study 1 is one category in February in one collection run with two served models; Study 2's ChatGPT answers are seven other categories in May with three served models. Every contrast between them in this study is a comparison of two snapshots. Section 4.3 shows the comparison with Study 2 restricted to ChatGPT's full models.
4. Headline Results
4.1 Product cards by platform and stage
Figure 1. Share of answers with a product card by platform and intent stage, Study 2. Google AI Mode exceeds 50% in seven of nine stages; Perplexity exceeds 10% in two.
Table 2a. Product-card rate by intent stage, both studies, with 95% Wilson intervals.
| Intent stage | Study 1, ChatGPT (95% CI) | n | Study 2, four engines pooled (95% CI) | n |
|---|---|---|---|---|
| Problem Recognition | 39.8% (36.6 to 43.0) | 900 | 20.4% (18.9 to 21.9) | 2,800 |
| Category Exploration | 72.2% (69.2 to 75.0) | 900 | 37.8% (36.0 to 39.7) | 2,704 |
| Budget Framing | 88.8% (86.8 to 90.5) | 1,080 | 54.8% (52.6 to 56.9) | 2,000 |
| Attribute Constrained | 81.8% (79.6 to 83.9) | 1,260 | 47.0% (45.1 to 48.9) | 2,652 |
| Comparison | 15.3% (13.1 to 17.8) | 900 | 35.7% (33.8 to 37.6) | 2,484 |
| Validation / Risk Reduction | 8.3% (6.7 to 10.3) | 900 | 26.2% (24.5 to 28.1) | 2,240 |
| Scenario Confirmation | 80.8% (78.5 to 82.9) | 1,253 | 39.6% (37.8 to 41.4) | 2,784 |
| Purchase Execution | 93.0% (91.1 to 94.5) | 900 | 43.0% (41.2 to 44.9) | 2,672 |
| Post Purchase | 2.8% (1.6 to 4.8) | 427 | 14.7% (13.2 to 16.3) | 1,999 |
Table 2b. Product-card rate by intent stage and platform, Study 2. 199 to 700 answers per cell.
| Intent stage | Google AI Mode | Copilot | ChatGPT | Perplexity |
|---|---|---|---|---|
| Problem Recognition | 31.7% | 32.0% | 17.3% | 0.6% |
| Category Exploration | 67.5% | 52.7% | 30.9% | 0.3% |
| Budget Framing | 88.6% | 69.2% | 47.0% | 14.2% |
| Attribute Constrained | 86.3% | 50.4% | 39.5% | 11.8% |
| Comparison | 66.7% | 46.1% | 29.8% | 0.3% |
| Validation / Risk Reduction | 54.1% | 35.9% | 14.3% | 0.7% |
| Scenario Confirmation | 74.7% | 43.0% | 31.2% | 9.5% |
| Purchase Execution | 72.8% | 55.4% | 37.6% | 6.4% |
| Post Purchase | 36.4% | 13.8% | 6.4% | 2.0% |
Google AI Mode's lowest stage (Post Purchase, 36.4%) is above ChatGPT's highest stage in Study 2 (Budget Framing, 47.0%) once ChatGPT's model mix is separated (section 4.3). The stage order agrees across engines at the extremes: Budget Framing first or second everywhere, Post Purchase last everywhere. Between those, the order is engine-specific; Google AI Mode cards comparison and validation questions at 66.7% and 54.1%, ChatGPT at 29.8% and 14.3%.
4.2 Agreement between engines on the same question
Figure 2. Number of engines, of four, that show a product card for the same question. 5,583 questions were asked on all four engines.
Figure 3. Pairwise agreement that both engines show a card for the same question, as a Jaccard index. Google AI Mode and Copilot agree most (0.45); every Perplexity pair is below 0.09.
Figure 4. Among questions where both engines show cards, overlap of the brand sets and of the product sets, Jaccard × 100. The engines retrieve from different product indexes: brand overlap is modest, product overlap is near zero.
Table 7. Pairwise agreement and overlap, Study 2. "P(B given A)" is the probability that the second engine shows a card given that the first does.
| Pair | Rate A | Rate B | Both show a card | Jaccard | Phi | P(B given A) | P(A given B) | Queries both with cards | Brand overlap | No brand in common | Product overlap | Cited-domain overlap |
|---|---|---|---|---|---|---|---|---|---|---|---|---|
| ChatGPT + Perplexity | 28.5% | 5.0% | 140 | 0.08 | 0.11 | 8.8% | 50.2% | 120 | 0.25 | 40.8% | 0.01 | 0.08 |
| ChatGPT + Google | 28.5% | 64.4% | 1,276 | 0.33 | 0.21 | 80.2% | 35.5% | 1,133 | 0.42 | 18.4% | 0.05 | 0.07 |
| ChatGPT + Copilot | 28.5% | 44.5% | 918 | 0.29 | 0.17 | 57.7% | 36.9% | 885 | 0.29 | 39.7% | 0.01 | 0.07 |
| Perplexity + Google | 5.0% | 64.4% | 266 | 0.07 | 0.15 | 95.3% | 7.4% | 228 | 0.29 | 29.4% | 0.01 | 0.12 |
| Perplexity + Copilot | 5.0% | 44.5% | 202 | 0.08 | 0.13 | 72.4% | 8.1% | 168 | 0.29 | 39.3% | 0.01 | 0.06 |
| Google + Copilot | 64.4% | 44.5% | 1,884 | 0.45 | 0.21 | 52.4% | 75.8% | 1,737 | 0.31 | 34.1% | 0.01 | 0.07 |
Given that Google AI Mode shows a card, ChatGPT does so 35.5% of the time; given that ChatGPT does, Google AI Mode does 80.2% of the time. ChatGPT's card queries are close to a subset of Google AI Mode's. The number of engines that card a question is a stage property: Budget Framing questions get cards on two or more engines 78.8% of the time, Post Purchase questions 9.6%.
4.3 ChatGPT by served model, and Study 1 against Study 2
Figure 5. ChatGPT's product-card rate by served model and stage in Study 2, with Study 1 (February 2026, dresses) for comparison. The mini model is a text engine for shopping; the full models match or exceed Study 1 at every stage except Purchase Execution.
Table 5. ChatGPT in Study 1 and Study 2, on comparable measures.
| Measure | Study 1 (dresses, Feb 2026) | Study 2, all ChatGPT answers | Study 2, gpt-5-3-mini | Study 2, gpt-5-5 | Study 2, gpt-5-3 |
|---|---|---|---|---|---|
| Answers | 8,520 | 5,584 | 3,372 | 1,682 | 508 |
| Product-card rate | 59.5% | 28.5% | 3.7% | 65.3% | 72.2% |
| Products per card-bearing answer | 8.0 | 4.0 | 4.3 | 4.1 | 3.7 |
| Distinct brands per answer | 4.9 | 2.6 | 2.3 | 2.7 | 2.6 |
| Top-10 brand share of slots | 32.7% | 13.3% | 17.9% | 9.3% | 51.9% |
| Slots on a brand-owned domain | 42.3% | 15.5% | 15.6% | 15.5% | 15.6% |
| Top merchant | Lulus | Walmart | Walmart | Walmart | Best Buy |
| Card price, median | $70 | $55 | $45 | $40 | $285 |
| Cards with a rating | 75.5% | 73.3% | 94.6% | 80.0% | 42.3% |
| Review count, median | 31 | 542 | 250 | 478 | 2,250 |
| Sources per answer | 20.9 | 11.8 | 10.1 | 15.8 | 9.8 |
| Answers citing no source | 3.5% | 14.5% | 17.4% | 4.0% | 26.2% |
| Editorial share of sources | 46.0% | 49.9% | 56.8% | 40.9% | 51.1% |
| Retail share of sources | 26.7% | 19.4% | 21.9% | 16.1% | 19.7% |
| Brand-owned share of sources | 10.3% | 4.9% | 4.7% | 3.3% | 15.5% |
| Community share of sources | 3.2% | 12.0% | 2.0% | 26.4% | 4.0% |
| Words per answer (mean) | 400 | 417 | 398 | 447 | 457 |
| Asks a clarifying question | 66.1% | 37.4% | 51.5% | 9.2% | 39.0% |
| Names a single pick | 26.6% | 34.7% | 23.7% | 51.9% | 52.4% |
The difference between Study 1's 59.5% and Study 2's 28.5% is a routing artefact, not a change in ChatGPT's behavior over time. On the full models, Study 2's product-card rate across seven categories is 66.9%, seven points above Study 1. What does not carry over from Study 1 to Study 2 is the depth of the shelf (8.0 products per carousel in Study 1 against 4.0), the share of slots on brand-owned stores (42.3% against 15.5%), and the role of Reddit (1.1% of Study 1's sources, 17.5% of gpt-5-5's). Dresses are a direct-to-consumer category hosted on brand stores; electronics, health, and home are retailer categories.
4.4 Stage profile, Study 1 against Study 2
Figure 7. Product-card rate by stage, Study 1 (ChatGPT, dresses) and Study 2 (four platforms pooled). The two studies agree on the top and bottom of the funnel and disagree on comparison and validation, where Google AI Mode and Copilot show cards and ChatGPT largely does not.
Within each stage the shelf also changes shape. Shelves are widest and flattest at Category Exploration (Study 1: 5.5 distinct brands per carousel; Study 2: 3.7 per answer) and narrowest at Comparison (2.1 and 1.9) and Validation (4.3 and 1.8). Purchase Execution is the one stage where citations turn retail on every engine (Study 1 48.1% retail, Study 2 48.5%). Post Purchase cards, where they appear, are accessories and consumables: tape, cables, chargers, cleaning products. Chapter 1 reports every stage in full.
4.5 Who gets cited
Figure 6. Source-type mix of cited pages by platform, Study 2. Google AI Mode is the community engine, Copilot the retail engine, ChatGPT and Perplexity the editorial engines.
Table 3a. Platform profile, Study 2: answer shape and card surface.
| Answer and card surface (Study 2) | Google AI Mode | Copilot | ChatGPT | Perplexity |
|---|---|---|---|---|
| Product-card rate | 64.4% | 44.5% | 28.5% | 5.0% |
| Products per card-bearing answer (mean) | 5.4 | 5.9 | 4.0 | 6.6 |
| Ads in answer | 3.9% | 0.0% | 0.1% | 0.0% |
| Map or places block | 1.5% | 4.1% | 2.0% | 0.0% |
| Words per answer (median) | 403 | 388 | 413 | 377 |
| Hedging phrases per 100 words | 0.43 | 0.55 | 0.86 | 0.94 |
| Asks a clarifying question | 69.0% | 92.5% | 37.4% | 61.0% |
| Ends with a question | 55.5% | 86.3% | 0.3% | 6.4% |
| Names a single pick | 8.5% | 24.8% | 34.7% | 5.3% |
| Names a retailer | 43.0% | 22.0% | 39.4% | 20.7% |
| Quotes a price | 54.2% | 44.0% | 41.2% | 14.4% |
Table 3b. Platform profile, Study 2: citations and card characteristics.
| Citations and card characteristics (Study 2) | Google AI Mode | Copilot | ChatGPT | Perplexity |
|---|---|---|---|---|
| Sources per answer (mean) | 9.0 | 6.0 | 11.8 | 10.2 |
| Answers citing no source | 17.8% | 1.9% | 14.5% | 0.1% |
| Editorial share of sources | 35.5% | 35.5% | 49.9% | 44.0% |
| Retail share of sources | 12.6% | 36.5% | 19.4% | 19.3% |
| Marketplace share of sources | 3.1% | 15.0% | 2.1% | 4.7% |
| Community (Reddit, YouTube, forums) share | 35.1% | 1.8% | 12.0% | 18.9% |
| Brand-owned share of sources | 6.4% | 3.2% | 4.9% | 3.7% |
| Answers citing reddit.com | 51.8% | 2.9% | 33.7% | 44.7% |
| Card price, median (USD) | $62 | $46 | $55 | $169 |
| Cards with a rating | 38.3% | 69.1% | 73.3% | 17.0% |
| Review count, median | 131 | 2,189 | 542 | 0 |
| Distinct brands in cards | 1,025 | 3,184 | 1,201 | 128 |
| Top-10 brand share of slots | 16.1% | 11.5% | 13.3% | 63.8% |
| Top merchant (share of slots) | Walmart (11%) | Amazon.com (25%) | Walmart (11%) | Electroeshop (5%) |
| Top-3 merchant share of slots | 24.2% | 47.5% | 24.7% | 9.4% |
Position in the citation list carries a type bias. On Copilot, the retail-plus-marketplace share rises from 37.9% at position 1 to 61.1% at position 5 and 67.8% at position 10 while the editorial share falls from 46.6% to 22.0%. On ChatGPT, Reddit's share rises from 8.7% at position 1 to 12.8% at position 5. ChatGPT is the only engine whose sources carry publication dates (59% of them); the median source was 293 days old in Study 1 and 244 days old in Study 2, and 41% to 43% were more than a year old.
4.6 Categories
Figure 8. Product-card rate by category and platform, Study 2. Electronics is the only category above 50% pooled and the only one where Perplexity shows cards.
Table 4. Category profile, Study 2, with Study 1 (women's dresses) for comparison. HHI is the Herfindahl index of brand slot shares; 0.044 means a handful of brands hold a large share, 0.008 means hundreds of brands share the shelf.
| Category | All platforms | Google AI Mode | Copilot | ChatGPT | Perplexity | Brand HHI | Editorial cited | Retail + marketplace cited | Community cited | Card price median | Cards rated | Review median |
|---|---|---|---|---|---|---|---|---|---|---|---|---|
| Electronics | 50.3% | 79.9% | 50.4% | 40.8% | 30.3% | 0.044 | 47.4% | 23.0% | 17.0% | $272 | 42.6% | 147 |
| Sports | 37.8% | 65.8% | 53.4% | 31.8% | 0.1% | 0.016 | 40.9% | 25.9% | 20.6% | $85 | 53.3% | 177 |
| Beauty | 35.9% | 70.1% | 50.2% | 23.1% | 0.3% | 0.008 | 48.8% | 22.1% | 17.7% | $23 | 50.3% | 3,238 |
| Toys | 31.9% | 56.8% | 42.6% | 28.1% | 0.2% | 0.021 | 33.0% | 34.0% | 15.1% | $34 | 59.1% | 164 |
| Home | 31.4% | 61.7% | 34.1% | 29.6% | 0.0% | 0.021 | 49.3% | 23.4% | 16.2% | $120 | 58.7% | 691 |
| Health | 30.1% | 44.9% | 53.0% | 22.4% | 0.1% | 0.009 | 43.5% | 24.8% | 12.0% | $19 | 65.3% | 1,328 |
| Auto | 28.7% | 67.7% | 23.0% | 24.0% | 0.1% | 0.016 | 31.2% | 30.0% | 25.6% | $65 | 58.4% | 180 |
| Women's dresses (Study 1, ChatGPT only) | 59.5% | 59.5% | 0.017 | 46.0% | 33.7% | 3.2% | $70 | 75.5% | 31 |
Electronics is the only concentrated category: Samsung, Apple, Sony, LG, and Google take 29% of its slots, and the Smartphones subcategory has an HHI of 0.185. Beauty and Health are the flattest, with 300 to 470 brands per subcategory and no brand above 20% of any subcategory. Copilot is the only engine that beats Google AI Mode in a category (Health, 53.0% against 44.9%). Subcategory card rates run from 54.4% (Headphones) to 21.0% (First Aid). The leading brand changes along the funnel inside a category: in Electronics, Samsung leads exploration and attribute stages and Apple leads comparison, validation, and purchase stages. Chapter 3 carries the 35 subcategories and the stage winners.
4.7 Stability on re-ask
Figure 9. For the same question asked twice on the same engine: share of pairs with the same outcome (card or no card), and brand overlap of the two card sets where both attempts showed cards.
Table 8. Re-ask consistency, Study 2 retry pairs.
| Platform | Retry pairs | Same outcome | Pairs with cards both times | Brand overlap | No brand in common | Product overlap | Cited-domain overlap |
|---|---|---|---|---|---|---|---|
| Google AI Mode | 884 | 89.8% | 669 | 0.67 | 4.3% | 0.23 | 0.33 |
| Copilot | 879 | 75.4% | 339 | 0.49 | 14.2% | 0.13 | 0.30 |
| ChatGPT | 883 | 57.6% | 167 | 0.44 | 19.8% | 0.06 | 0.32 |
| Perplexity | 873 | 86.4% | 165 | 0.77 | 9.1% | 0.70 | 0.47 |
| ChatGPT, same model both times | 439 | 90.2% | |||||
| ChatGPT, model switched | 444 | 25.5% |
Google AI Mode keeps its decision 89.8% of the time but re-picks products (product overlap 0.23). ChatGPT keeps its decision 90.2% of the time when the same model answers twice and 25.5% when the model switches. Perplexity is the most stable engine on both counts, partly because it so rarely shows cards. Any single AI check is one draw from a distribution; chapter 5 quantifies the draw.
4.8 Rank one inside the carousel, and the review profile of what is shown
Figure 10. Share of carousels in which the cheapest, priciest, top-rated, or most-reviewed product holds position 1. Base rates are 12.5% (Study 1), 22.6%, 15.7%, and 16.6%.
Figure 11. Review-count bands of surfaced products by platform. Copilot's cards are Amazon-hosted and heavily reviewed; Perplexity's are small-store products with no reviews; Study 1's dress cards have a median of 31 reviews.
On every engine and in every category, the shelf is pre-filtered to four stars: 2.6% to 7.6% of surfaced products are rated below 4.0, and mean ratings sit between 4.43 and 4.62. Review count, not rating, is the stronger within-carousel rank predictor on Google AI Mode (odds ratio 1.72 per within-carousel standard deviation), and the cheapest product is penalized there (0.64). Chapter 4 reports the models.
4.9 Where the cards link
Figure 12. Hosts of the product cards by platform. Amazon and Walmart dominate Copilot; Walmart, Best Buy, and Target lead ChatGPT; Perplexity links almost entirely to Shopify-style stores; Google AI Mode's links are search redirects, so its hosts are unknown.
In Study 1, 42.3% of card slots sat on the brand's own store; in Study 2's ChatGPT answers, 15.5%. The host of a surfaced product appears among the answer's cited sources for only 19.1% of Study 1's slots, and when it does its median position is twelfth. Cards are assembled from a product index; citations justify the prose.
4.10 What predicts a card
Figure 13. Permutation importance in the Study 2 model: platform first, intent second, category third, wording a distant fourth.
Figure 14. Permutation importance in the Study 1 model: intent first, style second, then the problem-language signal and question length.
Table 10. Model performance, both studies. AUC is the out-of-sample area under the ROC curve; 0.5 is chance.
| Model | n | Base rate | Logistic AUC | Gradient-boosting AUC | Pseudo-R² |
|---|---|---|---|---|---|
| Study 1: intent + style + model + 23 signals + 14 wording features | 8,520 | 59.5% | 0.922 | 0.943 | 0.48 |
| Study 1: intent only | 8,520 | 59.5% | 0.858 | 0.858 | 0.36 |
| Study 1: signals + wording, no intent | 8,520 | 59.5% | 0.880 | 0.918 | 0.37 |
| Study 1: intent + style + wording, no signals | 8,520 | 59.5% | 0.922 | 0.947 | 0.48 |
| Study 2: platform + category + intent + style + wording | 22,335 | 35.6% | 0.828 | 0.858 | 0.27 |
| Study 2: platform only | 22,335 | 35.6% | 0.761 | 0.761 | 0.18 |
| Study 2: intent only | 22,335 | 35.6% | 0.639 | 0.639 | 0.05 |
| Study 2: category only | 22,335 | 35.6% | 0.574 | 0.574 | 0.02 |
| Study 2: everything except platform | 22,335 | 35.6% | 0.673 | 0.685 | 0.07 |
| Study 2, ChatGPT only (incl. served model) | 5,584 | 28.5% | 0.955 | 0.962 | 0.59 |
| Study 2, Google AI Mode only | 5,584 | 64.4% | 0.783 | 0.788 | 0.20 |
| Study 2, Copilot only | 5,583 | 44.5% | 0.711 | 0.720 | 0.12 |
| Study 2, Perplexity only | 5,584 | 5.0% | 0.976 | 0.967 | 0.68 |
| Study 2, six categories with signals | 18,736 | 32.8% | 0.847 | 0.864 | |
| Study 2, ChatGPT full models only | 2,190 | 66.9% | 0.866 | 0.889 | 0.36 |
Odds ratios from the Study 2 logistic model, relative to ChatGPT, Auto, Attribute Constrained, and Conversational phrasing: Google AI Mode 5.9 (95% CI 5.4 to 6.4), Copilot 2.3, Perplexity 0.11; Electronics 3.5; Post Purchase 0.11, Problem Recognition 0.20, Validation 0.32; the word "best" in the question 1.24, buy-language 1.09, compare-language 0.91, all-lowercase phrasing 0.91. On ChatGPT alone, the served model is the single strongest feature in the entire study (importance 0.398, four times intent). Chapter 4 reports every model with its coefficients.
5. Discussion
Three conclusions follow from the results and hold across both studies.
First, "AI visibility" is not one number. The same brand can be on Google AI Mode's shelf for a budget question and absent from ChatGPT's for the same question, and the ChatGPT result can depend on which model answered that day. Measurement has to be per engine, per intent stage, and, for ChatGPT, per served model, or it measures routing noise.
Second, being cited and being carded are different outcomes with different inputs. Cards come from a product index: ChatGPT shows them in 14.5% of answers that cite no page, and the host of a surfaced product is rarely among the cited sources. Citations come from the open web and are dominated by editorial and community pages at the informational stages. A brand's reputation on Reddit and in reviews does its work at the comparison and validation stages, where cards are rare; its product data does its work at the budget, attribute, scenario, and purchase stages, where cards are common.
Third, the shelf is filtered before it is ranked. Surfaced products are almost all rated four stars or better, and the retailers that host them are concentrated: Walmart, Amazon, Best Buy, and Target on three engines, small Shopify stores on the fourth. Rating and review count then decide position inside the shelf on ChatGPT and Google AI Mode, and nothing we measured decides it on Copilot.
6. Limitations
- Both studies are United States, English, logged-out snapshots captured from each engine's consumer web interface by an automated collection service; no engine's developer API was used. Personalization, location, and mobile surfaces were not observed.
- The two studies differ in time, categories, collection run, and served models. No comparison between them is a trend.
- Study 2's Electronics category has no engine-tagged query signals; analyses that use those signals cover six categories (18,736 answers).
- ChatGPT's served model was not controlled. It is reported and modelled, but a run that pinned the model would be cleaner.
- Perplexity's cards include non-US stores with prices labeled in dollars; its price statistics use medians and are flagged where used.
- Cited pages were recorded by URL, title, position, and, on ChatGPT, date. Their content was not stored, so what a cited page says is not analyzed.
- Brand resolution and source typing are rule-based. Residual unresolved brands (3% to 14% by platform) and untyped domains (5%) are excluded or labeled, never guessed.
- No ranking data from web search and no merchant feed data were collected, so claims about eligibility are not testable here.
7. Structure of the Study
| Chapter | Scope |
|---|---|
| 1. The nine shopping intents | Each stage on each engine: what shoppers ask, who shows cards, who fills them, who is cited, how the answer is shaped, rank and price, and the style effects |
| 2. Four engines, one question | Agreement, overlap, platform personalities, Perplexity's search rewrites, the served-model analysis, and ChatGPT across the two studies |
| 3. Visibility by category | Seven categories, 35 subcategories, concentration and citation rankings, stage winners by category, women's dresses against the seven |
| 4. What predicts a product card | Every model with coefficients, brand-in-carousel models, rank-one models, confidence intervals and multiple-comparison tests |
| 5. Ten surprises | Stability, cards versus citations, price caps, brand-named questions, Google AI Mode's ads, citation position, source age, maps |
| 6. Corrections and changes | What earlier AEOsome reporting got wrong, what changed, and the versioning rule now applied |
| 7. Methodology and data | Full definitions, extraction rules, exclusions, limits, and the questions the data cannot answer |
7.1 Earlier articles on these datasets
Eight AEOsome articles published between April and October 2026 draw on the same two collections. This study supersedes their figures: each article was brought into line with version 2026-10 and carries a dated note, and chapter 6 lists what changed in each.
- We Analyzed 8,520 ChatGPT Shopping Queries, April 2026
- What Is the AI Shopping Customer Journey?, April 2026
- Are Reviews an AI Shopping Ranking Signal?, September 2026
- Strong Google Rankings, Invisible in AI, September 2026
- Product Description Structure for AI, September 2026
- Why Your Products Don't Show Up in AI Shopping Results, September 2026
- We Analyzed 22,335 AI Shopping Recommendations, September 2026
- Is AEO Worth It for eCommerce in 2026?, October 2026
8. Reproducibility, Versioning, and Citation
Every number in the study was computed from the raw engine responses by one code base, in two passes: a profiling pass that reconciled counts against the original collection summaries, and an analysis pass that produced the tables and figures. The de-duplicated Study 2 set, its overall product-card rate, and its platform, category, and intent rates reproduce the collection summaries exactly. Numbers on these pages are versioned: this is version 2026-10. A later recut will be published as a new version with a changelog in chapter 6, never as a silent edit.
Suggested citation. AEOsome Research (2026). AI Shopping Visibility Study 2026: How four AI engines answer 30,855 shopping questions. Version 2026-10. https://www.aeosome.com/blog/research/ai-shopping-visibility-study-2026/
Quote any figure with its study label and sample size as shown on the page. Figures and tables may be reproduced with a link to this page.
Appendix A. Bootstrap intervals for the headline rates
Table 6. 95% bootstrap intervals, 1,000 resamples.
| Slice | Product-card rate | 95% bootstrap CI | n |
|---|---|---|---|
| Study 2, ChatGPT | 28.5% | 27.3 to 29.7 | 5,584 |
| Study 2, Perplexity | 5.0% | 4.5 to 5.6 | 5,584 |
| Study 2, Google AI Mode | 64.4% | 63.2 to 65.7 | 5,584 |
| Study 2, Copilot | 44.5% | 43.3 to 45.7 | 5,583 |
| Study 2, Post Purchase | 14.7% | 13.1 to 16.2 | 1,999 |
| Study 1, Post Purchase | 2.8% | 1.4 to 4.4 | 427 |
| Study 2, Purchase Execution | 43.0% | 41.1 to 44.8 | 2,672 |
| Study 1, Purchase Execution | 93.0% | 91.1 to 94.7 | 900 |
| Study 2, Comparison | 35.7% | 33.9 to 37.6 | 2,484 |
| Study 1, Comparison | 15.3% | 13.0 to 17.6 | 900 |
| Study 2, Category Exploration | 37.8% | 36.1 to 39.6 | 2,704 |
| Study 1, Category Exploration | 72.2% | 69.2 to 75.0 | 900 |
| Study 2, Scenario Confirmation | 39.6% | 37.7 to 41.4 | 2,784 |
| Study 1, Scenario Confirmation | 80.8% | 78.5 to 82.8 | 1,253 |
| Study 2, Budget Framing | 54.8% | 52.6 to 56.9 | 2,000 |
| Study 1, Budget Framing | 88.8% | 86.9 to 90.6 | 1,080 |
| Study 2, Problem Recognition | 20.4% | 18.9 to 22.0 | 2,800 |
| Study 1, Problem Recognition | 39.8% | 36.8 to 43.0 | 900 |
| Study 2, Validation / Risk Reduction | 26.2% | 24.6 to 28.2 | 2,240 |
| Study 1, Validation / Risk Reduction | 8.3% | 6.6 to 10.1 | 900 |
| Study 2, Attribute Constrained | 47.0% | 44.9 to 48.7 | 2,652 |
| Study 1, Attribute Constrained | 81.8% | 79.7 to 83.9 | 1,260 |
| Study 2, Electronics | 50.3% | 48.8 to 51.9 | 3,599 |
| Study 2, Auto | 28.7% | 27.2 to 30.1 | 3,600 |
| Study 2, Beauty | 35.9% | 34.4 to 37.4 | 3,600 |
| Study 2, Health | 30.1% | 28.7 to 31.6 | 3,600 |
| Study 2, Home | 31.4% | 29.5 to 33.3 | 2,216 |
| Study 2, Sports | 37.8% | 36.2 to 39.2 | 3,600 |
| Study 2, Toys | 31.9% | 29.8 to 34.0 | 2,120 |
| Study 2, ChatGPT served model gpt-5-3-mini | 3.7% | 3.1 to 4.4 | 3,372 |
| Study 2, ChatGPT served model gpt-5-5 | 65.3% | 63.0 to 67.7 | 1,682 |
| Study 2, ChatGPT served model gpt-5-3 | 72.2% | 68.3 to 76.0 | 508 |
Appendix B. Glossary
- Product card, shelf, carousel. A structured product object in an answer; "carousel" is Study 1's name for ChatGPT's eight-slot card strip.
- De-duplicated set. Study 2's 22,335 answers, one per engine and question, last attempt kept.
- Served model. The model name returned with a ChatGPT answer.
- Intent stage. One of the nine shopping intents of the AEOsome framework.
- Phrasing style. Short, Medium, Long, Conversational, or Messy (Study 1 only).
- Source type. Community, marketplace, brand-owned, retail, editorial, or other, assigned per cited domain.
- Host. The domain a product card links to.
- HHI. Sum of squared brand shares of card slots; 1 means one brand holds every slot.
- Jaccard index. Size of the intersection of two sets divided by the size of their union.
- AUC. Area under the ROC curve on held-out data; 0.5 is chance, 1 is perfect.
- Permutation importance. AUC lost when one feature's values are shuffled.
- Wilson interval, bootstrap interval. 95% confidence intervals for a rate.
About the author. Vijaya Kumar Channalli is a serial SaaS founder and the founder of AEOsome (Tartu, Estonia), which helps eCommerce brands get their products recommended when shoppers ask AI what to buy. Read how we write, source and correct posts in our editorial policy.
Sources: AEOsome Research, AI Shopping Visibility Study 2026. Study 1: 8,520 ChatGPT answers, women's dresses, United States, February 28 to March 1, 2026. Study 2: 22,335 de-duplicated answers across ChatGPT, Google AI Mode, Microsoft Copilot, and Perplexity, seven categories, United States, May 5 to May 14, 2026.