Chapter 5. Ten Things the Data Showed That We Did Not Expect: Stability, Sourcing, Price Caps, Ads, Freshness, and Where AI Shopping Shows Nothing
Chapter 5 of the AI Shopping Visibility Study 2026. Ten findings that were not in the research questions: the same question asked twice flips ChatGPT's product card 42% of the time; cards do not come from the cited pages; Perplexity's shelf is a different merchant network; named brands lose a third

AEOsome Research. Vijaya Kumar Channalli. Chapter 5 of the AI Shopping Visibility Study 2026, version 2026-10. The hub carries the abstract, the ten headline findings, the methods summary, and the other chapters. This chapter reports the findings that were not in the research questions.
Abstract
Chapters 1 to 4 answer the questions the study was designed to answer: how product-card rates vary by intent stage, engine, and category, and what predicts them. This chapter reports ten results that surfaced while answering those questions and that changed how we read the rest. Each is stated as a finding, backed by the tables and figures that support it, and labelled Confirmed, Suggestive, or Hypothesis. In order: (1) asking the same question twice changes whether ChatGPT shows a product card in 42% of pairs, and the cause is the served model, not the question; (2) product cards do not come from the pages the answer cites, and answers that cite nothing show cards as often or more often; (3) Perplexity's shelf is a different merchant network of small stores with no review data, a third of its card-bearing answers include a non-US store; (4) when the shopper names a brand, that brand is in the cards 65% to 87% of the time and other brands hold a third to half the slots; (5) a stated price cap is broken on 14% to 27% of surfaced products; (6) Google AI Mode's ads appear beside its best organic shelves, and Home is the ad category; (7) the first citation is a retailer and the fifth is a forum; (8) ChatGPT's dated sources have a median age of eight to ten months; (9) maps appear for one local-intent question in four on three engines and never on Perplexity; (10) one question in five gets no product card on any engine, and the words that predict that are ownership and logistics words. A runners-up section covers the fixed shelf size, the shape of card-bearing answers, and Google's two product surfaces. The correction to the published retail-citation share, the second-ranked surprise in the internal report, is published in chapter 6.
1. Scope and Methods
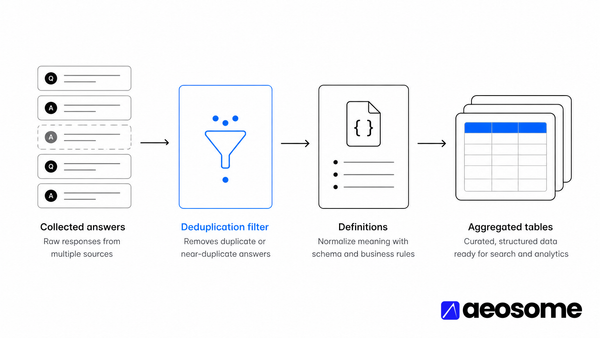
Data. Study 1: 8,520 ChatGPT answers to women's-dress questions, collected February 28 to March 1, 2026. Study 2: 22,335 de-duplicated answers (27,255 collected, 4,920 retries removed) from ChatGPT, Google AI Mode, Microsoft Copilot, and Perplexity across seven categories, collected May 5 to 14, 2026. Every Study 2 rate in this chapter is on the de-duplicated basis unless a section says otherwise; the stability analysis in section 2 is the one place where the removed retries are the object of study.
Retry pairs. Study 2 asked 3,519 question-and-engine combinations more than once. For each, the first and last attempt form a pair. Agreement is whether both attempts produced a card or both produced none. Overlap between two attempts that both produced cards is the Jaccard index: the number of brands (or product titles, or cited domains) common to both, divided by the number in either. Study 1 contains 1,286 pairs of questions with identical text, which gives the same test on the February models.
Sourcing. An answer "cites no source" when the engine returned an empty source list. A product's host domain is "cited" when it appears anywhere in the same answer's source list. A brand mention in the text is "absent from source titles" when the brand name does not appear in the title of any cited source for that answer.
Brand-named questions. In Study 1 the question set carries a tag for a named brand. In Study 2 the tagger's brand signal covers six categories, so a lexicon of 1,452 brand-naming questions per engine was built by matching the resolved-brand list against the question text; the lexicon agrees with the tagger's signal on 86% of tagged questions.
Price caps. A capped question states a maximum price ("under $200", "less than $50"). A surfaced product is over the cap when its listed price exceeds the cap; "over by 50%" means it exceeds 1.5 times the cap. Study 2's tagger catches small caps, so its median cap is $30 against $150 in Study 1.
Citation position. Each cited source has a position in the engine's list. Domain types (Editorial, Retail, Marketplace, Brand-owned, Community) follow the single rule set described in chapter 7.
Source age. Where the engine returns a publication date for a source (57% of ChatGPT's sources in both studies; the other engines return none), age is the number of days between that date and the collection date.
Confidence labels. Confirmed: the pattern holds in both studies or in a single study with n in the thousands and a consistent direction across slices. Suggestive: a single slice or n in the tens. Hypothesis: a mechanism proposed to explain a confirmed pattern that the data cannot test.
2. Surprise 1. Ask the Same Question Twice and ChatGPT's Card Appears or Disappears 42% of the Time
Finding (Confirmed). On Study 2's retry pairs, Google AI Mode produced the same outcome (card or no card) on 89.8% of pairs, Perplexity on 86.4%, Copilot on 75.4%, and ChatGPT on 57.6%. ChatGPT's instability is entirely the served model: when both attempts were answered by the same model, agreement was 90.2%; when the model switched between attempts, 25.5%.
Figure 1. Agreement on card-or-no-card between first and last attempt, and brand and product overlap when both attempts showed cards, by engine. ChatGPT's two right-hand bars split its pairs by whether the served model changed.
Table 1. Stability of the same question asked twice. Study 2 retry pairs by engine, and Study 1's identical-text pairs. Overlap is the mean Jaccard index over pairs where both attempts showed cards.
| Engine | Pairs | Same outcome | Pairs with cards both times | Brand overlap | No brand in common | Product overlap | Cited-domain overlap | Word-count change (median) |
|---|---|---|---|---|---|---|---|---|
| Google AI Mode | 884 | 89.8% | 669 | 0.67 | 4.3% | 0.23 | 0.33 | 58 |
| Copilot | 879 | 75.4% | 339 | 0.49 | 14.2% | 0.13 | 0.30 | 61 |
| ChatGPT | 883 | 57.6% | 167 | 0.44 | 19.8% | 0.06 | 0.32 | 44 |
| Perplexity | 873 | 86.4% | 165 | 0.77 | 9.1% | 0.70 | 0.47 | 70 |
| ChatGPT, same model both times | 439 | 90.2% | 0.44 | |||||
| ChatGPT, model switched | 444 | 25.5% | ||||||
| Study 1, identical question texts | 1,286 | 96.0% | 0.25 | 15.5% | 0.06 | 0.34 |
Evidence. Even when the outcome agrees, the shelf does not. Among pairs where both attempts showed cards, the two brand sets overlapped by 0.44 on ChatGPT, 0.49 on Copilot, 0.67 on Google AI Mode, and 0.77 on Perplexity; the product sets by 0.06, 0.13, 0.23, and 0.70. One ChatGPT pair in five (19.8%) shared no brand at all. Google AI Mode and ChatGPT keep roughly the brand list and re-pick the products; Perplexity returns largely the same products. Cited domains overlapped by 0.30 to 0.47 on every engine, so the sources move too.
Figure 2. Study 1's 1,286 pairs of identical question texts. Agreement on carousel-or-none is 96%, but only one brand in four and one product in sixteen is common to both answers.
Study 1 is the control. Its February models were stable on the outcome (96.0% agreement; 94.9% when both answers came from the same model and 97.1% when they did not, so the model did not matter then) and just as unstable on the contents: brand overlap 0.25, product overlap 0.06, and 15.5% of pairs with no brand in common.
Interpretation. Two things follow. First, a single answer is a sample, not a measurement. Any tool that reads one ChatGPT answer and reports a brand as "visible" or "invisible" is reporting a coin toss weighted by the day's model routing; a visibility measurement needs repeated asks and should report a rate. Second, for ChatGPT the published platform-level rate is a mixture. The hub and chapter 2 report ChatGPT by served model for this reason.
3. Surprise 2. The Product Cards Do Not Come From the Pages the Answer Cites
Finding (Confirmed as a pattern; the mechanism is a Hypothesis). The cards and the citations are produced separately. Answers that cite no source show cards as often as, or more often than, answers that do; the host domain of a surfaced product is among the answer's cited sources for 19% of Study 1's 40,544 card slots, and when it is, its median position is twelfth; and 61% to 81% of brand mentions in the answer text appear in no cited source title.
Figure 3. ChatGPT, Study 2: share of answers that cite no source, and the card rate among sourceless and sourced answers, by stage. At the Problem and Post-purchase stages sourceless answers carry cards three to ten times as often as sourced ones.
Table 2. Answers that cite no source. Study 2 ChatGPT by stage, Study 1 in the last row, and the sourceless share by engine.
| Stage (Study 2 ChatGPT unless noted) | Answers citing no source | n | Card rate, no source | Card rate, sourced |
|---|---|---|---|---|
| Problem Recognition | 6.4% | 45 | 46.7% | 15.3% |
| Category Exploration | 12.3% | 83 | 22.9% | 32.0% |
| Budget Framing | 29.0% | 145 | 44.1% | 48.2% |
| Attribute Constrained | 21.7% | 144 | 36.1% | 40.5% |
| Comparison | 9.5% | 59 | 35.6% | 29.2% |
| Validation / Risk Reduction | 4.1% | 23 | 26.1% | 13.8% |
| Scenario Confirmation | 14.1% | 98 | 26.5% | 31.9% |
| Purchase Execution | 28.9% | 193 | 40.9% | 36.2% |
| Post Purchase | 4.0% | 20 | 50.0% | 4.6% |
| Study 1, all stages | 3.5% | 300 | 70.7% | 59.1% |
| Engine | Answers citing no source | Card rate, no source | Card rate, sourced |
|---|---|---|---|
| Google AI Mode | 17.8% | ||
| Copilot | 1.9% | ||
| ChatGPT | 14.5% | ||
| Perplexity | 0.1% |
Evidence. 14.5% of Study 2's ChatGPT answers and 17.8% of Google AI Mode's cite no source; Copilot (1.9%) and Perplexity (0.1%) almost always cite something. In Study 1, 300 answers (3.5%) cited nothing and 70.7% of them carried a carousel against 59.1% of sourced answers. In Study 2 ChatGPT the gap is largest at the stages where cards are rare: at Problem Recognition sourceless answers show cards at 46.7% against 15.3%, at Post Purchase 50.0% against 4.6%. At the card-rich middle stages (Budget, Attribute, Scenario) sourced answers are slightly ahead. Cards and citations are not substitutes for each other at the answer level; they vary independently.
Figure 4. Brands named in the answer text against brands in the cards, among card-bearing answers. Fewer than half of the text brands on ChatGPT, Copilot, and Perplexity appear in the cards, and 73% to 96% of card-bearing answers name at least one brand that is not on the shelf.
Table 3. Text brands, card brands, and source titles. Both studies; Study 1 is row A.
| Slice | Answers naming a brand in text | Brands in text (mean) | Text brands when cards shown | Text brands when no cards | Text brands also in cards | Card brands also in text | Answers naming a brand not in cards | Brand mentions absent from every source title |
|---|---|---|---|---|---|---|---|---|
| A | 89.8% | 4.6 | 6.4 | 2.0 | 67.4% | 87.5% | 86.9% | 80.6% |
| B ChatGPT | 84.1% | 2.5 | 3.7 | 2.0 | 45.4% | 63.7% | 95.9% | 69.7% |
| B Google AI Mode | 86.0% | 2.6 | 3.3 | 1.6 | 58.5% | 69.7% | 72.6% | 74.6% |
| B Copilot | 79.2% | 2.1 | 2.6 | 1.7 | 45.1% | 39.3% | 72.5% | 60.6% |
| B Perplexity | 73.2% | 1.7 | 3.6 | 1.6 | 21.8% | 36.8% | 89.6% | 71.2% |
Figure 5. Share of brand mentions in the answer text that appear in the title of no cited source. The engine names brands it did not read about in the pages it cites.
The prose and the shelf also disagree. On ChatGPT in Study 2, 45.4% of the brands named in the text appear in the cards and 63.7% of the card brands are named in the text; 95.9% of card-bearing answers name at least one brand that is not on the shelf. Perplexity is the extreme: 21.8% of its text brands reach the cards. And across engines, 61% (Copilot) to 75% (Google AI Mode) of brand mentions, 81% in Study 1, appear in no cited source title.
Interpretation (Hypothesis). The pattern is consistent with a three-part answer: a product index supplies the cards, retrieved pages supply the citations, and the model's own knowledge supplies the brand names in the prose. The citations justify the text; they do not select the shelf. For a merchant this means that being cited and being shown are different goals with different levers: a page that earns citations earns prose mentions, while card presence depends on being in the product index that the engine queries. The data cannot test the mechanism directly, because the engines do not expose their product index; what it can show is that citation and card presence are close to independent at the answer level.
4. Surprise 3. Perplexity's Shelf Is a Different Merchant Network
Finding (Confirmed). 99.3% of Perplexity's card URLs carry the session and variant parameters of a Shopify-style storefront; its 1,842 card slots come from 823 distinct store domains, 63% of which appear once; 83% of its products show zero reviews and 17% carry a rating; 8.6% of its slots are on non-US store domains, and a third of its card-bearing answers include at least one such store.
Figure 6. Perplexity against ChatGPT and Copilot on four markers of its merchant network. Google AI Mode is omitted because every one of its card links is a Google redirect that hides the merchant.
Table 4. Non-US stores and high prices in the card slots. Study 2, three engines with visible merchant domains.
| Engine | Card slots | Slots on non-US domains (%) | Card-bearing answers with a non-US store | Slots priced over $3,000 | Most common non-US domains |
|---|---|---|---|---|---|
| Perplexity | 1,842 | 8.6 | 33.2% | 7.8% | {'co.uk': 65, 'ca': 24, 'com.au': 14, 'de': 12, 'ro': 11, 'co.za': 9} |
| ChatGPT | 6,370 | 1.0 | 2.5% | 1.3% | {'ca': 20, 'com.au': 13, 'co.uk': 10, 'de': 9, 'nl': 5, 'co.za': 2} |
| Copilot | 14,560 | 0.5 | 1.7% | 1.0% | {'ca': 38, 'co.uk': 16, 'de': 8, 'fr': 4, 'it': 1, 'nl': 1} |
Evidence. On the other engines the Shopify-style share is 25% (ChatGPT), 11% (Copilot), and 29% in Study 1. Copilot's slots are 25% Amazon and 18% Walmart; ChatGPT's are 19% Walmart, 8% Target, and 6% Best Buy; Perplexity's are 0% Amazon, 0% Walmart, and 0.1% Best Buy. In the hub's merchant concentration measure, Perplexity's ten largest merchants hold 16% of its slots against 48% for Copilot. Non-US domains are 1.0% of ChatGPT's slots and 0.5% of Copilot's; Perplexity's are led by .co.uk (65 slots), .ca (24), .com.au (14), .de (12), .ro (11), and .co.za (9), with prices printed with a dollar sign regardless of the store's currency. 7.8% of Perplexity's slots are priced above $3,000, against 1.0% to 1.3% on the other two engines; several are foreign-currency prices rendered as dollars.
Figure 7. Review counts attached to surfaced products, by engine. Copilot's shelf is the most reviewed (58% of slots carry 1,000 or more reviews); Perplexity's is 83% zero-review products.
The review profile is the mirror image of the others. Copilot's median product carries 2,189 reviews, ChatGPT's 542, Google AI Mode's 131 (where present), Study 1's 31; Perplexity's median is zero. Its rating, where present, is the highest of any engine (mean 4.62; 82% at 4.5 or above), which is what a small sample of a store's own ratings looks like.
Interpretation. Perplexity is not a worse version of the other shelves; it draws on a different catalog. A merchant that is invisible on ChatGPT and Copilot because it lacks marketplace review volume can be visible on Perplexity, and a merchant that dominates Copilot through Amazon listings may not appear on Perplexity at all. The low card rate (5.0%) limits how much this matters today; the structure matters if the card rate rises.
5. Surprise 4. When the Shopper Names a Brand, Other Brands Take a Third to Half the Slots
Finding (Confirmed). In Study 1, when a question named a brand and ChatGPT showed a carousel, the named brand was in it 87.3% of the time and other brands held 32.5% of the slots. In Study 2 the named brand was present in 68.8% of card-bearing answers on Google AI Mode and in 65.2% of card-bearing answers on ChatGPT. On Copilot the named brand appeared in 67.1% of card-bearing answers, and on Perplexity in 51.4% (35 answers). Other brands held 46% to 52% of the slots on every engine.
Figure 8. Card rate for brand-named against generic questions, the share of card-bearing answers in which the named brand appears, and the share of slots taken by other brands. Study 1 is the left group.
Table 5. Brand-named against generic questions. Study 1 (tagged brand) and Study 2 (lexicon-matched).
| Slice | Brand-named questions | Generic questions | Card rate, named | Card rate, generic | Named with cards | Named brand present | Competitor share of slots | Brands per answer, named | Brands per answer, generic | Single pick, named | Single pick, generic |
|---|---|---|---|---|---|---|---|---|---|---|---|
| S1 ChatGPT | 1,321 | 7,199 | 21.1% | 66.6% | 276 | 87.3% | 32.5% | 1.6 | 5.1 | 28.5% | 26.2% |
| ChatGPT | 1,452 | 4,132 | 31.1% | 27.6% | 431 | 65.2% | 52.4% | 2.0 | 2.9 | 28.1% | 37.0% |
| Perplexity | 1,452 | 4,132 | 2.4% | 5.9% | 35 | 51.4% | 49.3% | 1.5 | 2.2 | 4.1% | 5.8% |
| Google AI Mode | 1,452 | 4,132 | 70.2% | 62.4% | 892 | 68.8% | 48.6% | 2.0 | 3.1 | 6.7% | 9.1% |
| Copilot | 1,452 | 4,131 | 47.8% | 43.4% | 689 | 67.1% | 46.4% | 2.1 | 3.4 | 20.6% | 26.2% |
Evidence. The two studies disagree on whether naming a brand helps get a card at all. In Study 1 brand-named questions produced a carousel a third as often as generic ones (21.1% against 66.6%) and the carousel narrowed from 5.1 brands to 1.6. In Study 2 the direction reverses on three engines: Google AI Mode 70.2% against 62.4%, Copilot 47.8% against 43.4%, ChatGPT 31.1% against 27.6%; Perplexity alone goes the other way (2.4% against 5.9%). Shelves still narrow when a brand is named (2.0 against 2.9 brands on ChatGPT; 2.0 against 3.1 on Google AI Mode), but less than in Study 1.
Figure 9. Study 1: when a brand-named question produced a carousel, how often the named brand was in it, by stage. Comparison questions, which name two brands, carry the named brand least often.
Figure 10. Study 1: the twelve most-named dress brands. Share of carousels in which the named brand appears, with the carousel rate when the brand is named in brackets. Nordstrom is the outlier because the question names a retailer and the carousel shows the brands it stocks.
Table 6. Study 1 by named brand. Brands named in at least 28 questions.
| Named brand | Questions | Carousel rate | Carousels | Brand present when carousel shown |
|---|---|---|---|---|
| Zara | 120 | 23.3% | 28 | 92.9% |
| Reformation | 119 | 21.0% | 25 | 72.0% |
| Anthropologie | 97 | 21.6% | 21 | 71.4% |
| H&M | 94 | 14.9% | 14 | 92.9% |
| Mango | 93 | 22.6% | 21 | 100.0% |
| Free People | 88 | 17.0% | 15 | 93.3% |
| Nordstrom | 87 | 20.7% | 18 | 22.2% |
| Everlane | 82 | 23.2% | 19 | 100.0% |
| Aritzia | 70 | 15.7% | 11 | 100.0% |
| Madewell | 68 | 11.8% | 8 | 100.0% |
| ASOS | 61 | 19.7% | 12 | 91.7% |
| Banana Republic | 57 | 19.3% | 11 | 90.9% |
| Abercrombie & Fitch | 52 | 25.0% | 13 | 69.2% |
| Express | 45 | 11.1% | 5 | 100.0% |
| Lulus | 41 | 29.3% | 12 | 100.0% |
| Ralph Lauren | 37 | 48.6% | 18 | 100.0% |
| Guess | 34 | 23.5% | 8 | 100.0% |
| Michael Kors | 29 | 27.6% | 8 | 100.0% |
| Calvin Klein | 28 | 21.4% | 6 | 100.0% |
By brand, presence is near total for most direct-to-consumer labels (Mango, Everlane, Aritzia, Madewell, Lulus, Ralph Lauren at 100%) and lower for Reformation (72.0%), Anthropologie (71.4%), and Abercrombie & Fitch (69.2%). Nordstrom is present in 22.2% of its own carousels, because the engine answers "Nordstrom dresses" with the brands Nordstrom sells. By stage, Comparison questions (which name two brands and ask which is better) carry a named brand in 79.0% of carousels, Purchase Execution in 94.9%.
Interpretation. The Study 1 result, that naming a brand suppresses the carousel, was published as a rule; Study 2 shows it is not one. Brand names cluster at the Comparison and Validation stages, which have low card rates on every engine, and the Study 1 effect is mostly that stage mix. What survives both studies is the slot share: a named brand gets its own shelf alone about half the time at best, and the other half is shared with the engine's idea of its competitors. Brand-protection monitoring should measure that share, not just presence. Chapter 6 records the correction to the published rule.
6. Surprise 5. A Stated Price Cap Is Broken on One Card in Five
Finding (Confirmed). When the shopper states a maximum price, 14.3% of the products ChatGPT surfaced in Study 1 exceed it (20,162 priced slots, median cap $150), and 26.7% of carousels contain at least one over-cap product. In Study 2's six tagged categories (median cap $30), 27.0% of ChatGPT's surfaced products exceed the cap, 23.3% of Copilot's, and 18.8% of Google AI Mode's; 28.4% of ChatGPT's capped answers are entirely over the cap.
Figure 11. Capped questions: share of surfaced products over the cap, over it by 50% or more, and share of answers with any over-cap product or entirely over the cap. Perplexity is omitted (eight priced products).
Table 7. Price caps and the products shown. Both studies.
| Study | Engine | Capped questions | Priced products | Over the cap | Over by 50%+ | Median price / cap | Answers with any over-cap product | Answers entirely over cap | Median cap |
|---|---|---|---|---|---|---|---|---|---|
| Study 1 | ChatGPT | 3,228 | 20,162 | 14.3% | 10.0% | 0.46 | 26.7% | 4.7% | $150 |
| Study 2 | ChatGPT | 271 | 408 | 27.0% | 25.5% | 0.60 | 33.7% | 28.4% | $30 |
| Study 2 | Copilot | 271 | 975 | 23.3% | 20.4% | 0.58 | 28.4% | 17.0% | $30 |
| Study 2 | Google AI Mode | 271 | 872 | 18.8% | 16.2% | 0.60 | 32.4% | 18.7% | $30 |
| Study 2 | Perplexity | 271 | 8 | 87.5% | 50.0% | 1.53 | 100.0% | 0.0% | $30 |
Evidence. Most over-cap products are not near misses. In Study 1, 10.0 of the 14.3 points are products priced at 1.5 times the cap or more; in Study 2 the ratio is similar on every engine (ChatGPT 25.5 of 27.0 points; Copilot 20.4 of 23.3; Google AI Mode 16.2 of 18.8). The median surfaced product sits well under the cap (0.46 of the cap in Study 1, 0.58 to 0.60 in Study 2), so the shelf as a whole respects the budget and a minority of slots ignore it. Perplexity returned eight priced products on capped questions, seven of them over the cap; the sample is too small to report a rate.
Interpretation. Budget Framing is the stage with the highest card rate on every engine (chapter 1), and the engines treat the cap as a ranking preference, not a filter. For merchants whose products sit just above a common price threshold, this is an opening: an item at $220 can appear on an "under $200" shelf. For shoppers, and for anyone building on top of these answers, the cap is advisory.
7. Surprise 6. Google AI Mode's Ads Sit Beside Its Best Organic Shelves, and Home Is the Ad Category
Finding (Confirmed). Google AI Mode showed ads on 3.9% of its 5,584 answers, 4.2 ads per ad-bearing answer. When ads appeared, the organic card rate was 84.7%; without ads, 63.6%. By category the ad rate runs from Home at 10.1% to Beauty at 0.3%.
Figure 12. Google AI Mode's ad rate by category. Home carries ads at three times the average; Beauty almost never.
Figure 13. Google AI Mode's organic card rate when ads are present and when they are absent.
Table 8. Ads on Google AI Mode. Overall, by stage, by category, and by phrasing style.
| Measure | Value |
|---|---|
| Answers with ads | 3.9% |
| Ads per ad-bearing answer (mean) | 4.2 |
| Organic card rate when ads present | 84.7% |
| Organic card rate when no ads | 63.6% |
| Stage | Ad rate |
|---|---|
| Problem Recognition | 3.0% |
| Category Exploration | 5.2% |
| Budget Framing | 2.6% |
| Attribute Constrained | 5.3% |
| Comparison | 3.5% |
| Validation / Risk Reduction | 3.0% |
| Scenario Confirmation | 6.0% |
| Purchase Execution | 3.1% |
| Post Purchase | 1.8% |
| Category | Ad rate |
|---|---|
| Home | 10.1% |
| Sports | 5.9% |
| Health | 4.2% |
| Electronics | 3.1% |
| Auto | 2.9% |
| Toys | 2.1% |
| Beauty | 0.3% |
| Style | Ad rate |
|---|---|
| Conversational | 4.2% |
| Long | 3.2% |
| Medium | 3.5% |
| Short | 4.4% |
Evidence. By stage the ad rate is highest at Scenario Confirmation (6.0%), Attribute Constrained (5.3%), and Category Exploration (5.2%), and lowest at Post Purchase (1.8%) and Budget Framing (2.6%). Phrasing style does not matter (3.2% to 4.4%). The categories with the most ads are not the categories with the most cards: Home has one of the lower organic card rates (chapter 3) and the highest ad rate.
Interpretation. The ad rate was low in May 2026, and the pattern is what one would expect from an auction that fires on commercial queries: ads appear on the questions Google already judges commercial, which are the questions that already get an organic shelf. Ads do not displace organic cards in this sample; they accompany them. Home's lead suggests advertiser density in that category, not a ranking decision. This is one answer of the study's seven categories at one point in time; the rate should be tracked, not assumed.
8. Surprise 7. The First Citation Is a Retailer, the Fifth Is a Forum
Finding (Confirmed). The type of page an engine cites depends on where in the list it sits. On Copilot, Retail and Marketplace together are 38% of position-1 sources, 61% at position 5, and 68% at position 10, while Editorial falls from 47% to 22%. On ChatGPT in Study 2, Community sources (mostly reddit.com) rise from 10.0% at position 1 to 15.4% at position 5. On ChatGPT in Study 1, position 1 is 25.0% Retail and 11.0% Brand-owned; positions 3 to 5 are 16% Retail and 14% to 15% Marketplace.
Figure 14. Copilot: source type by citation position. The further down the list, the more retail.
Figure 15. ChatGPT, Study 2: source type by position. Editorial holds; Community peaks in the middle of the list.
Figure 16. ChatGPT, Study 1: source type by position. Retail and Brand-owned lead at position 1 and return at position 10; Marketplace and Community fill the middle.
Table 9. Source type by citation position. Positions 1, 3, 5, and 10 for each slice. Community includes reddit.com, shown separately in the last column.
| Slice | Position | Sources | Editorial | Retail | Marketplace | Brand-owned | Community | reddit.com |
|---|---|---|---|---|---|---|---|---|
| Study 1 ChatGPT | 1 | 8,220 | 48.0% | 25.0% | 7.8% | 11.0% | 2.2% | 1.2% |
| Study 1 ChatGPT | 3 | 8,220 | 52.2% | 15.7% | 13.6% | 6.4% | 5.1% | 3.5% |
| Study 1 ChatGPT | 5 | 8,219 | 52.0% | 15.6% | 14.7% | 7.0% | 4.0% | 2.5% |
| Study 1 ChatGPT | 10 | 8,219 | 51.1% | 24.8% | 7.3% | 8.9% | 0.9% | 0.2% |
| Study 2 ChatGPT | 1 | 4,774 | 54.8% | 17.0% | 1.8% | 5.5% | 10.0% | 8.7% |
| Study 2 ChatGPT | 3 | 4,737 | 53.2% | 14.7% | 2.4% | 4.1% | 14.5% | 11.9% |
| Study 2 ChatGPT | 5 | 4,711 | 51.1% | 15.5% | 3.6% | 4.3% | 15.4% | 12.8% |
| Study 2 ChatGPT | 10 | 4,679 | 49.4% | 22.9% | 1.5% | 5.2% | 9.1% | 3.8% |
| Study 2 Perplexity | 1 | 5,577 | 49.4% | 19.5% | 5.4% | 3.0% | 13.1% | 4.7% |
| Study 2 Perplexity | 3 | 5,576 | 45.3% | 19.1% | 5.9% | 3.3% | 17.0% | 7.1% |
| Study 2 Perplexity | 5 | 5,565 | 47.9% | 20.6% | 4.9% | 3.7% | 13.9% | 4.7% |
| Study 2 Perplexity | 10 | 5,317 | 43.3% | 18.3% | 3.6% | 4.3% | 21.2% | 8.2% |
| Study 2 Google AI Mode | 1 | 4,591 | 31.5% | 15.5% | 3.3% | 8.2% | 34.6% | 14.5% |
| Study 2 Google AI Mode | 3 | 4,162 | 30.4% | 14.3% | 3.6% | 6.8% | 38.6% | 14.4% |
| Study 2 Google AI Mode | 5 | 3,760 | 32.4% | 13.5% | 3.6% | 6.2% | 37.4% | 14.8% |
| Study 2 Google AI Mode | 10 | 2,723 | 38.0% | 11.9% | 2.8% | 5.9% | 33.6% | 10.2% |
| Study 2 Copilot | 1 | 5,475 | 46.6% | 25.6% | 12.3% | 3.7% | 1.5% | 0.5% |
| Study 2 Copilot | 3 | 5,236 | 44.4% | 29.1% | 11.9% | 3.2% | 2.1% | 0.6% |
| Study 2 Copilot | 5 | 3,391 | 26.5% | 43.1% | 18.0% | 3.3% | 1.7% | 0.4% |
| Study 2 Copilot | 10 | 979 | 22.0% | 48.8% | 19.0% | 3.0% | 1.1% | 0.1% |
Evidence. Google AI Mode is flat: Community sources are 34% to 39% of every position and Editorial 30% to 38%. Perplexity is nearly flat, with Community rising from 13.1% at position 1 to 21.2% at position 10. Copilot's list also shrinks fast (5,475 answers have a position-1 source; 979 have a tenth), so its deep positions describe its longest answers. Position also predicts age on ChatGPT: the median dated source at position 1 is 175 days old in Study 2 (258 in Study 1); at position 5 and beyond, 325 (342).
Interpretation. Citation studies that count all sources equally will overstate retail on Copilot and understate it at the top of ChatGPT's list. Where a page is cited matters as much as whether it is: the first slot is the one a shopper sees without scrolling. For publishers, editorial pages hold the top slot on Copilot and ChatGPT; for retailers, the top slot on ChatGPT is the one place where a store page leads.
9. Surprise 8. The Sources Behind the Answers Are a Year Old
Finding (Confirmed, ChatGPT only). Among ChatGPT's dated sources, the median age at query time was 293 days in Study 1 and 244 days in Study 2. 42.7% and 40.8% were more than a year old, 23.6% and 28.1% more than two years, and 5.9% and 9.0% were under 30 days.
Figure 17. Age bands of ChatGPT's dated sources at the moment of the query, both studies. Two in five are over a year old; fewer than one in ten is from the last month.
Table 10. Source age. Both studies, with medians by position, by type, and by stage.
| Slice | Sources with a date | Median age (days) | Under 30 days | Under 90 days | Over 1 year | Over 2 years | Median age at position 1 | Median age at position 5+ | Editorial median | Retail median | Community median |
|---|---|---|---|---|---|---|---|---|---|---|---|
| Study 1 ChatGPT | 57.3% | 293 | 5.9% | 18.9% | 42.7% | 23.6% | 258 | 342 | 335 | 326 | 579 |
| Study 2 ChatGPT | 56.6% | 244 | 9.0% | 27.8% | 40.8% | 28.1% | 175 | 325 | 191 | 253 | 1029 |
| Stage | Study 1 median age | Study 2 ChatGPT median age |
|---|---|---|
| Problem Recognition | 280 | 293 |
| Category Exploration | 276 | 167 |
| Budget Framing | 394 | 181 |
| Attribute Constrained | 278 | 171 |
| Comparison | 311 | 411 |
| Validation / Risk Reduction | 283 | 378 |
| Scenario Confirmation | 288 | 197 |
| Purchase Execution | 326 | 98 |
| Post Purchase | 419 | 277 |
Figure 18. Median source age by stage. In Study 2 the purchase stages draw the freshest pages (Purchase Execution 98 days) and the comparison and validation stages the oldest (378 to 411 days).
Evidence. Community sources are the oldest by far (median 579 days in Study 1, 1,029 in Study 2), because the forum threads the engine cites are years old. Editorial sources are the youngest in Study 2 (191 days) and Retail pages sit between (253). The stage pattern in Study 2 is wide: Purchase Execution 98 days, Category Exploration 167, Attribute Constrained 171, against Comparison 411 and Validation 378. Study 1's stages are narrower (276 to 419 days). Only ChatGPT returns dates; the other three engines cannot be measured.
Interpretation. Freshness is a ranking input the engine appears to use at the purchase end of the journey and not at the research end. A buying guide written two years ago is still being cited to compare products; a product page is cited when it is current. For publishers, the implication is that comparison and validation content has a long shelf life in these engines and is not displaced by newer pages quickly; for merchants, product pages are read fresh, so stale prices and availability on the page are what the engine will repeat.
10. Surprise 9. Maps Appear for One Local-Intent Question in Four, and Copilot Shows Them for Toys
Finding (Suggestive; 59 local-intent questions per engine). A map or places block appeared in 4.1% of Copilot's answers, 2.0% of ChatGPT's, 1.5% of Google AI Mode's, and none of Perplexity's. On the 59 questions the tagger marked as local intent, the rates were 25.4%, 27.1%, 18.6%, and 0%.
Figure 19. Map or places block by engine, for all answers and split by the local-intent tag.
Table 11. Maps and places blocks. Study 2, with the rate by category.
| Engine | Map or places block, all answers | With local intent (n=59) | Without local intent | By category |
|---|---|---|---|---|
| Google AI Mode | 1.5% | 18.6% | 1.4% | Auto 4.8%; Beauty 1.7%; Electronics 0.3%; Health 0.4%; Home 0.5%; Sports 0.4%; Toys 1.7% |
| Copilot | 4.1% | 25.4% | 4.3% | Auto 4.0%; Beauty 2.2%; Electronics 1.9%; Health 4.0%; Home 1.4%; Sports 4.7%; Toys 13.6% |
| ChatGPT | 2.0% | 27.1% | 2.1% | Auto 5.3%; Beauty 1.0%; Electronics 0.0%; Health 1.2%; Home 0.7%; Sports 1.8%; Toys 4.3% |
| Perplexity | 0.0% | 0.0% | 0.0% | Auto 0.1%; Beauty 0.0%; Electronics 0.1%; Health 0.0%; Home 0.0%; Sports 0.0%; Toys 0.0% |
Evidence. Copilot's maps are concentrated in Toys (13.6% of its Toys answers) and Sports (4.7%); ChatGPT's and Google AI Mode's in Auto (5.3% and 4.8%). Most maps appear on questions the tagger did not mark as local (Copilot 4.3% of non-local answers), so the local-intent tag under-counts the questions the engines read as local.
Interpretation. Three engines treat some shopping questions as "where can I buy this near me" questions and answer with a places block instead of, or beside, a product shelf. Toys is the clearest case: the engine reads "toy store" into questions about toys. For retailers with physical stores, local listings are a product surface on Copilot and ChatGPT; for Perplexity they are not. The sample is small and the finding is labelled accordingly.
11. Surprise 10. One Question in Five Gets No Product Card on Any Engine, and the Words Predict Which
Finding (Confirmed). Of the 5,583 Study 2 questions asked on all four engines, 1,223 (21.9%) produced no product card on any of them. The share rises to 79% for Toys questions at the Problem Recognition stage and 67% to 71% for Post Purchase questions in Sports, Auto, and Beauty. The words with the highest lift in the no-card questions are "games", "wrong", "take", "pain", "food", "wheels", "difference", "months", "before", "bought", "kids", and "clean".
Figure 20. The twelve category-and-stage cells with the highest share of questions that got no product card on any engine. Each cell holds 100 questions unless the table notes otherwise.
Figure 21. Words over-represented in the no-card questions. A lift of 2 means the word is twice as common in no-card questions as in all questions.
Table 12. Where no engine shows a product. Top 20 cells and the rate by phrasing style.
| Category | Stage | Questions | No card on any engine |
|---|---|---|---|
| Toys | Problem Recognition | 100 | 79.0% |
| Sports | Post Purchase | 100 | 71.0% |
| Auto | Post Purchase | 100 | 68.0% |
| Beauty | Post Purchase | 100 | 67.0% |
| Health | Scenario Confirmation | 100 | 63.0% |
| Health | Validation / Risk Reduction | 100 | 56.0% |
| Health | Post Purchase | 100 | 54.0% |
| Home | Problem Recognition | 100 | 53.0% |
| Health | Problem Recognition | 100 | 48.0% |
| Auto | Problem Recognition | 100 | 46.0% |
| Sports | Problem Recognition | 100 | 44.0% |
| Home | Comparison | 60 | 43.3% |
| Home | Validation / Risk Reduction | 60 | 41.7% |
| Auto | Validation / Risk Reduction | 100 | 40.0% |
| Beauty | Problem Recognition | 100 | 35.0% |
| Beauty | Validation / Risk Reduction | 100 | 35.0% |
| Electronics | Problem Recognition | 100 | 30.0% |
| Auto | Purchase Execution | 100 | 30.0% |
| Toys | Comparison | 61 | 26.2% |
| Electronics | Post Purchase | 99 | 25.3% |
| Style | No card on any engine |
|---|---|
| Conversational | 24.2% |
| Long | 21.0% |
| Medium | 22.8% |
| Short | 19.5% |
Evidence. The no-card questions are the ones about owning, using, and fixing, not about choosing: "wrong", "pain", "months", "before", "bought", "clean", "miles". Health's Scenario Confirmation (63%) and Validation (56%) cells rank high because safety questions about supplements and devices draw advice, not products. Phrasing style barely matters (19.5% for Short to 24.2% for Conversational). Electronics' hardest cell is Problem Recognition at 30%, which is lower than the easiest cell of several other categories.
Interpretation. A fifth of commercial-adjacent questions are structurally product-free: all four engines read them as information requests. This is the floor under any visibility program. It also locates the opportunity: the cells with a 40% to 70% no-card rate are the ones where a merchant that does get a card has the shelf alone, and the words that predict a no-card question (ownership, logistics, trouble) are the words a product page can address directly.
12. Runners-up
Three further observations did not make the list but inform the chapters that use them.
The shelf has a fixed size. 94.7% of Study 1's carousels held exactly eight products. In Study 2, ChatGPT's mode is four (45% of its card-bearing answers), Copilot's is six (55%), Perplexity's spreads from four to eight with a mode of eight, and Google AI Mode's spreads from one to sixteen. The shelf size is a product decision of the engine, not a function of the question; a merchant competing for presence is competing for one of four slots on ChatGPT and one of six on Copilot.
Figure 22. Number of products in the card strip, by engine. Study 1 is almost always eight; Study 2's ChatGPT almost always four.
Table 13. Card-strip size. Both studies.
| Slice | Card-bearing answers | Mean | Median | Mode | Distribution |
|---|---|---|---|---|---|
| A | 5,072 | 8.0 | 8 | 8 | 8: 95% |
| B ChatGPT | 1,592 | 4.0 | 4 | 4 | 1: 5%; 2: 11%; 3: 15%; 4: 45%; 5: 15%; 6: 3%; 8: 2% |
| B Perplexity | 280 | 6.6 | 7 | 8 | 4: 7%; 5: 11%; 6: 21%; 7: 27%; 8: 32% |
| B Google AI Mode | 3,598 | 5.4 | 4 | 4 | 1: 9%; 2: 10%; 3: 15%; 4: 17%; 5: 12%; 6: 10%; 7: 6%; 8: 6%; 9: 4%; 10: 2% |
| B Copilot | 2,485 | 5.9 | 6 | 6 | 2: 4%; 3: 8%; 4: 10%; 5: 10%; 6: 55%; 10: 5%; 12: 3% |
Answers with cards are longer and hedge less. On every Study 2 engine the card-bearing answer is longer than the cardless one (ChatGPT 483 against 391 words; Google AI Mode 433 against 364; Copilot 415 against 354), and on every engine it hedges less (Study 1: 0.36 against 1.05 hedging phrases per 100 words; ChatGPT Study 2: 0.59 against 0.98). Perplexity is the exception on length (290 against 394 words): its card-bearing answers are short lists. ChatGPT in Study 2 also names a single pick far more often when it shows cards (72.6% against 19.6%).
Figure 23. Words per answer and hedging phrases (per 100 words, scaled by 100 for the chart) with and without cards, by engine.
Table 14. Shape of the answer with and without cards. Both studies.
| Slice | Words, with cards | Words, without | Hedging per 100, with | Hedging per 100, without | Clarifying, with | Clarifying, without | Single pick, with | Single pick, without | Sources, with | Sources, without |
|---|---|---|---|---|---|---|---|---|---|---|
| A | 406 | 390 | 0.36 | 1.05 | 76.6% | 50.6% | 21.4% | 34.2% | 20.3 | 21.8 |
| B ChatGPT | 483 | 391 | 0.59 | 0.98 | 16.7% | 45.7% | 72.6% | 19.6% | 12.6 | 11.4 |
| B Perplexity | 290 | 394 | 0.66 | 0.95 | 46.8% | 61.7% | 37.9% | 3.6% | 15.5 | 9.9 |
| B Google AI Mode | 433 | 364 | 0.39 | 0.51 | 70.8% | 65.7% | 11.8% | 2.4% | 8.5 | 9.8 |
| B Copilot | 415 | 354 | 0.46 | 0.64 | 93.1% | 92.1% | 41.0% | 11.7% | 8.5 | 4.0 |
Google AI Mode has two product surfaces. Google's products appear inline in the text and in a separate card strip, and the two do not always coincide: 33.2% of its answers show inline products only, 17.1% a card strip only, 14.1% both, and 35.6% neither. The strip is most common at Budget Framing (30% strip only, 30% both) and rarest at Comparison (4.5% strip only). ChatGPT's inline products are the usual case (26.2% of answers) and its strip is rare (2.1%). The study's product-card definition counts either surface; a measurement that counts only the strip would halve Google AI Mode's rate.
Table 15. Inline products against the card strip. Study 2, Google AI Mode and ChatGPT, all stages.
| Engine | Inline products only | Card strip only | Both | Neither | Inline products when present (mean) | Strip products when present (mean) |
|---|---|---|---|---|---|---|
| Google AI Mode | 33.2% | 17.1% | 14.1% | 35.6% | 4.4 | 4.5 |
| ChatGPT | 26.2% | 2.1% | 0.1% | 71.5% | 3.7 | 7.2 |
13. Discussion
Taken together, the ten surprises describe engines whose product shelf is assembled separately from their text, drawn from an index the merchant does not see, sized by a product decision, re-sampled on every ask, and filtered loosely by the shopper's constraints. Four consequences follow for how the rest of the study should be read and how visibility should be measured.
Measure rates, not answers. The stability result (section 2) means that a single answer carries little information about a brand's standing. Every rate in this study is computed over hundreds of questions per cell and, for ChatGPT, reported by served model.
Separate citation from presence. Sections 3 and 8 show that the pages an engine cites, the brands it names, and the products it shows are three different lists with different drivers. A content strategy earns citations; a catalog strategy earns cards; the two should be measured separately and neither predicts the other.
Treat the shopper's constraints as preferences. Price caps (section 6) and brand names (section 5) shape the shelf without determining it. This is an opening for merchants near a threshold and a warning for anyone relying on the answer to enforce one.
Expect a different Perplexity. Section 4 shows a merchant network that overlaps little with the others. The low card rate limits the impact today; the structure means a Perplexity visibility result does not transfer.
14. Limitations Specific to This Chapter
- The retry pairs were not designed as a stability experiment. Retries happened where the collector re-asked a question, and the interval between attempts varies from minutes to days.
- The lexicon-matched brand-named questions in Study 2 include retailer names and may include common words that are also brand names; the 86% agreement with the tagger's signal bounds the error but does not remove it.
- Price caps in Study 2 are small ($30 median) because the tagger catches small caps; the over-cap rates are not comparable in level with Study 1's.
- Source dates are available for ChatGPT only, for 57% of its sources, and the engine may return the page's last-modified date rather than its publication date.
- The local-intent tag covers 59 questions per engine; the maps result is reported as Suggestive.
- Ad rates reflect one collection window (May 5 to 14, 2026). Ad load changes with advertiser demand and with Google's product decisions.
- Google AI Mode's merchants are hidden behind redirect links, so it is excluded from the merchant-network and non-US store comparisons.
- All ten findings are observational. None establishes that changing a page, a price, or a question would change an engine's answer.
Navigation. Previous: Chapter 4. What predicts a product card · Next: Chapter 6. Corrections and changes · AI Shopping Visibility Study 2026 (hub, abstract, and all chapters).
About the author. Vijaya Kumar Channalli is a serial SaaS founder and the founder of AEOsome (Tartu, Estonia), which helps eCommerce brands get their products recommended when shoppers ask AI what to buy. Read how we write, source and correct posts in our editorial policy.
Sources: AEOsome Research, AI Shopping Visibility Study 2026, chapter 5. Study 1: 8,520 ChatGPT answers, women's dresses, United States, February 28 to March 1, 2026. Study 2: 22,335 de-duplicated answers across ChatGPT, Google AI Mode, Microsoft Copilot, and Perplexity, seven categories, United States, May 5 to May 14, 2026. Hub: https://www.aeosome.com/blog/research/ai-shopping-visibility-study-2026/