Chapter 2. ChatGPT vs Google AI Mode vs Copilot vs Perplexity: We Asked All Four the Same 5,583 Shopping Questions
Chapter 2 of the AI Shopping Visibility Study 2026. The same 5,583 shopping questions on four AI engines: how often they agree on showing products, how little their shelves overlap, each engine's personality, Perplexity's search rewrites, which ChatGPT model answered, and ChatGPT across two studies.

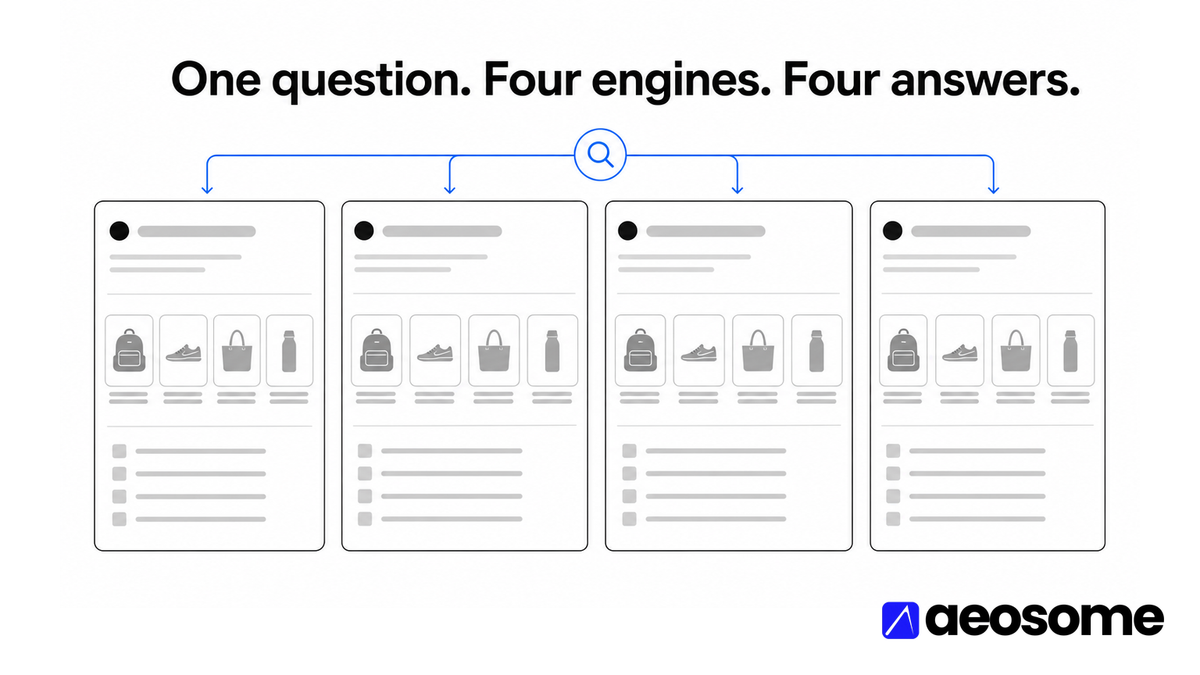
AEOsome Research. Vijaya Kumar Channalli. Chapter 2 of the AI Shopping Visibility Study 2026, version 2026-10. The hub carries the abstract, the ten findings, the methods summary, and the other chapters. This chapter compares the four engines on the same questions.
Abstract
Study 2 asked 5,584 shopping questions on ChatGPT, Google AI Mode, Microsoft Copilot, and Perplexity in May 2026; 5,583 of them were answered on all four, giving 22,335 de-duplicated answers. This chapter treats each question as a controlled comparison. It reports whether the engines agree on showing a product card (they do not: 1.6% of questions get a card on all four, 21.9% on none), whether they show the same products when they both show cards (they do not: brand overlap 0.25 to 0.42, product overlap 0.01 to 0.05 by Jaccard), and how each engine's answers differ in shape, citations, and merchant network. It then reports two things about ChatGPT specifically: that its product surface depended on which of three models served the answer (3.7% of answers with a card on gpt-5-3-mini, 65% and 72% on the full models), and how its May 2026 answers across seven categories compare with Study 1's February 2026 answers about women's dresses. It closes with Perplexity's search rewrites, which compress 85% of questions into a search of about four words and add the word "best" to a fifth of them.
1. Scope and Reading Guide
All rates in this chapter use the de-duplicated Study 2 set. "Same question" means the same query text sent to each engine within the same collection window. Agreement is measured on the 5,583 questions answered on all four engines; overlap is measured on the subset where both engines in a pair showed cards. Definitions of product card, brand, and source type are in the hub and chapter 7. Jaccard is the size of the intersection of two sets divided by the size of their union; phi is the correlation of two yes/no outcomes.
2. Do the Engines Agree on Showing Products?
Figure 1. Number of engines, of four, that show a product card for the same question. The modal outcome is one engine.
Table 1. The ten most common patterns of which engines show a card for the same question.
| Engines showing a card | Questions | Share |
|---|---|---|
| None | 1,223 | 21.9% |
| Google AI Mode | 1,170 | 21.0% |
| Copilot + Google AI Mode | 1,020 | 18.3% |
| ChatGPT + Copilot + Google AI Mode | 670 | 12.0% |
| ChatGPT + Google AI Mode | 471 | 8.4% |
| Copilot | 440 | 7.9% |
| ChatGPT | 157 | 2.8% |
| ChatGPT + Copilot | 153 | 2.7% |
| Copilot + Google AI Mode + Perplexity | 102 | 1.8% |
| ChatGPT + Copilot + Google AI Mode + Perplexity | 92 | 1.6% |
The single most common pattern after "none" is Google AI Mode alone (21.0%), then Google AI Mode with Copilot (18.3%), then those two with ChatGPT (12.0%). Patterns that include Perplexity account for 7.5% of questions in total; the full set of four appears in 92 questions (1.6%).
Figure 2. Pairwise agreement that both engines show a card, as a Jaccard index.
Table 2. Pairwise agreement, Study 2. "Expected if independent" is the number of questions on which both engines would show a card if each engine's decision were independent of the other's; the observed count is above it for every pair, but not by much.
| Pair | Rate, first | Rate, second | Both show a card | Expected if independent | Jaccard | Phi | P(second given first) | P(first given second) |
|---|---|---|---|---|---|---|---|---|
| ChatGPT + Perplexity | 28.5% | 5.0% | 140 | 80 | 0.08 | 0.11 | 8.8% | 50.2% |
| ChatGPT + Google | 28.5% | 64.4% | 1,276 | 1,025 | 0.33 | 0.21 | 80.2% | 35.5% |
| ChatGPT + Copilot | 28.5% | 44.5% | 918 | 708 | 0.29 | 0.17 | 57.7% | 36.9% |
| Perplexity + Google | 5.0% | 64.4% | 266 | 180 | 0.07 | 0.15 | 95.3% | 7.4% |
| Perplexity + Copilot | 5.0% | 44.5% | 202 | 124 | 0.08 | 0.13 | 72.4% | 8.1% |
| Google + Copilot | 64.4% | 44.5% | 1,884 | 1,601 | 0.45 | 0.21 | 52.4% | 75.8% |
Agreement is weak in absolute terms. The strongest pair, Google AI Mode and Copilot, shows cards on the same question 1,884 times, a Jaccard of 0.45 and a phi of 0.21. Every pair with Perplexity is below 0.09. The phi correlations of 0.11 to 0.21 mean that knowing one engine's decision tells you a little, not a lot, about another's.
Figure 4. Conditional rates: if one engine shows a card, how often does each other engine show one for the same question?
The conditional view explains the structure. Given a card on Google AI Mode, ChatGPT shows one 35.5% of the time; given a card on ChatGPT, Google AI Mode shows one 80.2% of the time. ChatGPT's card questions are close to a subset of Google AI Mode's. The same holds for Copilot (given Copilot, Google AI Mode 75.8%; given Google AI Mode, Copilot 52.4%) and, in the extreme, for Perplexity (given Perplexity, Google AI Mode 95.3%). Google AI Mode is the superset engine: what the others card, it almost always cards too, and it cards a great deal more.
Table 3. Number of engines showing a card for the same question, by stage and by category.
| Intent stage | No engine | One | Two | Three | All four |
|---|---|---|---|---|---|
| Problem Recognition | 47.9% | 28.4% | 18.0% | 5.7% | 0.0% |
| Category Exploration | 14.8% | 34.5% | 35.4% | 15.4% | 0.0% |
| Budget Framing | 2.6% | 18.6% | 41.6% | 31.6% | 5.6% |
| Attribute Constrained | 4.5% | 32.0% | 37.9% | 22.3% | 3.3% |
| Comparison | 15.5% | 38.3% | 34.3% | 11.8% | 0.2% |
| Validation / Risk Reduction | 31.6% | 37.3% | 25.7% | 5.2% | 0.2% |
| Scenario Confirmation | 14.9% | 33.6% | 32.9% | 15.2% | 3.3% |
| Purchase Execution | 12.4% | 27.8% | 37.0% | 20.7% | 2.1% |
| Post Purchase | 57.1% | 33.3% | 4.6% | 4.4% | 0.6% |
| Category | No engine | One | Two | Three | All four |
|---|---|---|---|---|---|
| Auto | 23.9% | 43.1% | 27.3% | 5.7% | 0.0% |
| Beauty | 21.0% | 29.0% | 35.4% | 14.3% | 0.2% |
| Electronics | 11.8% | 24.2% | 24.8% | 29.3% | 9.9% |
| Health | 30.3% | 30.6% | 27.4% | 11.7% | 0.0% |
| Home | 23.1% | 37.5% | 30.1% | 9.2% | 0.0% |
| Sports | 19.1% | 28.1% | 35.4% | 17.2% | 0.1% |
| Toys | 26.4% | 31.5% | 30.0% | 12.1% | 0.0% |
Figure 5. Engines showing a card per question, by category.
The number of engines that card a question is a property of the question's stage and category. Budget Framing questions get cards on two or more engines 78.8% of the time, Post Purchase questions 9.6%. Electronics questions get cards on three or more engines 39.2% of the time, Auto questions 5.7%. Chapter 1 reports the stage view in full; chapter 3 the category view.
3. When Two Engines Both Show Cards, Do They Show the Same Things?
Figure 3. Among questions where both engines show cards: overlap of brand sets, product sets, and cited-domain sets.
Table 4. Overlap on the same question, Study 2.
| Pair | Questions, both with cards | Brand overlap (Jaccard) | No brand in common | Product overlap (Jaccard) | Rank agreement of shared brands (Spearman) | Questions with 3+ shared brands | Questions, both with sources | Cited-domain overlap (Jaccard) | No domain in common |
|---|---|---|---|---|---|---|---|---|---|
| ChatGPT + Perplexity | 120 | 0.25 | 40.8% | 0.01 | 0.50 | 2 | 4,768 | 0.08 | 29.7% |
| ChatGPT + Google | 1,133 | 0.42 | 18.4% | 0.05 | 0.39 | 108 | 3,920 | 0.07 | 33.5% |
| ChatGPT + Copilot | 885 | 0.29 | 39.7% | 0.01 | 0.06 | 21 | 4,683 | 0.07 | 47.6% |
| Perplexity + Google | 228 | 0.29 | 29.4% | 0.01 | 0.21 | 9 | 4,584 | 0.12 | 21.0% |
| Perplexity + Copilot | 168 | 0.29 | 39.3% | 0.01 | -0.50 | 5 | 5,470 | 0.06 | 49.8% |
| Google + Copilot | 1,737 | 0.31 | 34.1% | 0.01 | 0.28 | 107 | 4,509 | 0.07 | 50.0% |
No. Brand overlap is modest: 0.42 for ChatGPT and Google AI Mode on 1,133 questions, 0.31 for Copilot and Google AI Mode on 1,737, 0.29 for ChatGPT and Copilot on 885, 0.25 to 0.29 for the Perplexity pairs on 120 to 228. Between 18% and 41% of question pairs share no brand at all. Product overlap, measured on normalized product titles, is close to zero on every pair (0.01 to 0.05). Where three or more brands are shared, their rank order agrees modestly on the two Google AI Mode pairs with ChatGPT (Spearman 0.39) and Copilot (0.28) and not at all on the ChatGPT and Copilot pair (0.06, 21 questions).
Cited domains overlap even less: Jaccard 0.06 to 0.12, and 21% to 50% of question pairs share no cited domain. The engines retrieve from different product indexes and read different parts of the web. For a brand, presence on one engine is evidence of presence on that engine only.
4. Platform Personalities
4.1 How the answer is shaped
Figure 6. Answer shape by engine: share of answers that ask a clarifying question, end with a question, name a single pick, name a retailer, and quote a price.
Figure 7. Formatting per answer: bullets, headings, bold phrases, and links, by engine.
Table 5a. Platform profile: answer and card surface.
| Answer and card surface | Google AI Mode | Copilot | ChatGPT | Perplexity |
|---|---|---|---|---|
| Product-card rate | 64.4% | 44.5% | 28.5% | 5.0% |
| Products per card-bearing answer (mean / median) | 5.4 / 4 | 5.9 / 6 | 4.0 / 4 | 6.6 / 7 |
| Ads in answer | 3.9% | 0.0% | 0.1% | 0.0% |
| Map or places block | 1.5% | 4.1% | 2.0% | 0.0% |
| Words per answer (median) | 403 | 388 | 413 | 377 |
| Bullets / headings / bold / links per answer | 9 / 0 / 15 / 5 | 12 / 7 / 20 / 10 | 23 / 6 / 9 / 7 | 12 / 1 / 3 / 6 |
| Hedging phrases per 100 words | 0.43 | 0.55 | 0.86 | 0.94 |
| Asks a clarifying question | 69.0% | 92.5% | 37.4% | 61.0% |
| Ends with a question | 55.5% | 86.3% | 0.3% | 6.4% |
| Names a single pick | 8.5% | 24.8% | 34.7% | 5.3% |
| Names a retailer | 43.0% | 22.0% | 39.4% | 20.7% |
| Quotes a price | 54.2% | 44.0% | 41.2% | 14.4% |
Copilot and Google AI Mode turn the answer into a dialogue: Copilot ends 86.3% of shopping answers with a question and asks a clarifying question in 92.5%; Google AI Mode 55.5% and 69.0%. ChatGPT ends 0.3% of answers with a question and instead decides: it names a single pick in 34.7% of answers (63.0% at Budget Framing, chapter 1), against 24.8% for Copilot and 5.3% for Perplexity. Perplexity hedges most (0.94 hedging phrases per 100 words) and ChatGPT nearly as much (0.86); Google AI Mode hedges least (0.43) and names a single pick in only 8.5% of answers. ChatGPT is the most heavily formatted (23 bullets and 6 headings per answer); Google AI Mode uses no headings at all and the most bold phrases after Copilot. Answer length is similar across engines (377 to 413 words at the median).
Card counts differ: when ChatGPT shows cards it shows a median of 4; Google AI Mode 4 (mean 5.4, with a long tail to 16); Copilot 6 (55% of its card-bearing answers hold exactly 6); Perplexity 7. Study 1's ChatGPT carousel held exactly 8 in 94.7% of cases. Google AI Mode is the only engine that shows ads (3.9% of answers) and Copilot the one most likely to show a map block (4.1%; 25% when the question has local intent, chapter 5).
4.2 Who each engine cites
Figure 8. Cited source types by engine.
Figure 9. Reddit, YouTube, and Amazon as a share of each engine's sources.
Figure 10. Citation volume: sources and distinct domains per answer, and the share of answers citing nothing.
Table 5b. Platform profile: citations and card characteristics.
| Citations and cards | Google AI Mode | Copilot | ChatGPT | Perplexity |
|---|---|---|---|---|
| Sources per answer (mean) | 9.0 | 6.0 | 11.8 | 10.2 |
| Distinct domains per answer | 6.3 | 5.1 | 8.3 | 8.7 |
| Answers citing no source | 17.8% | 1.9% | 14.5% | 0.1% |
| Editorial share of sources | 35.5% | 35.5% | 49.9% | 44.0% |
| Retail share | 12.6% | 36.5% | 19.4% | 19.3% |
| Marketplace share | 3.1% | 15.0% | 2.1% | 4.7% |
| Community share (Reddit, YouTube, forums, social) | 35.1% | 1.8% | 12.0% | 18.9% |
| Brand-owned share | 6.4% | 3.2% | 4.9% | 3.7% |
| reddit.com share of sources | 12.1% | 0.5% | 7.5% | 7.4% |
| youtube.com share of sources | 13.0% | 0.7% | 0.1% | 8.4% |
| amazon.com share of sources | 2.5% | 12.4% | 0.0% | 0.0% |
| Answers citing reddit.com | 51.8% | 2.9% | 33.7% | 44.7% |
| Sources carrying a publication date | 0.0% | 0.0% | 59.4% | 0.0% |
| Videos per answer | 0.02 | 0.00 | 0.00 | 1.18 |
| Related queries per answer | 0.0 | 0.0 | 0.0 | 4.9 |
| Card price, median (USD) | $62 | $46 | $55 | $169 |
| Cards with a price | 59.8% | 100.0% | 99.0% | 100.0% |
| Cards with a rating | 38.3% | 69.1% | 73.3% | 17.0% |
| Mean rating | 4.56 | 4.50 | 4.51 | 4.62 |
| Review count, median | 131 | 2,189 | 542 | 0 |
| Cards with zero reviews | 0.0% | 0.0% | 0.0% | 83.0% |
| Distinct brands in cards | 1,025 | 3,184 | 1,201 | 128 |
| Top-10 brands' share of slots | 16.1% | 11.5% | 13.3% | 63.8% |
| Distinct merchants | 2,160 | 1,665 | 1,939 | 823 |
| Top merchant (share of slots) | Walmart (11%) | Amazon.com (25%) | Walmart (11%) | Electroeshop (5%) |
| Top-3 merchants' share of slots | 24.2% | 47.5% | 24.7% | 9.4% |
Table 6. Domains each engine cites far more than the others do. Restricted to domains with at least 200 citations across the study; the percentage is the share of that domain's citations that came from the engine named.
| Engine | Domains it cites far more than the others do (domains with 200+ citations in the study) |
|---|---|
| Google AI Mode | quora.com (100% of its 486 citations); instagram.com (99% of its 735 citations); tiktok.com (96% of its 615 citations); facebook.com (88% of its 2,184 citations); youtube.com (56% of its 11,620 citations); ebay.com (55% of its 211 citations); pcmag.com (53% of its 510 citations); cnn.com (49% of its 232 citations) |
| Copilot | amazon.com (77% of its 5,472 citations); walmart.com (62% of its 4,660 citations); newegg.com (57% of its 211 citations); etsy.com (55% of its 383 citations); lowes.com (44% of its 306 citations); ebay.com (41% of its 211 citations); target.com (40% of its 1,996 citations); walgreens.com (40% of its 285 citations) |
| ChatGPT | gummysearch.com (100% of its 309 citations); redditrecs.com (100% of its 313 citations); fragrantix.com (89% of its 212 citations); cdc.gov (76% of its 292 citations); scienceinsights.org (74% of its 442 citations); epa.gov (73% of its 332 citations); engineerfix.com (73% of its 677 citations); vogue.com (67% of its 203 citations) |
| Perplexity | oreateai.com (89% of its 246 citations); nytimes.com (75% of its 345 citations); alibaba.com (61% of its 3,326 citations); staples.com (59% of its 203 citations); cosmopolitan.com (57% of its 201 citations); cnet.com (51% of its 660 citations); businessinsider.com (46% of its 252 citations); pcmag.com (45% of its 510 citations) |
Google AI Mode is the community engine: 35.1% of its sources are Reddit, YouTube, Facebook, Instagram, TikTok, Quora, and forums; it is the only engine that cites Instagram, TikTok, and Quora at all (99%, 96%, and 100% of those domains' citations in the study), and 88% of Facebook's. Reddit appears in 51.8% of its answers and YouTube is its single most-cited domain (13.0% of sources).
Copilot is the retail engine: 36.5% of its sources are retailers and 15.0% marketplaces. Amazon alone is 12.4% of its citations, and 77% of all amazon.com citations in the study came from Copilot; 62% of walmart.com's did. Copilot cites Reddit in 2.9% of answers and is the only engine for which community pages are a rounding error (1.8% of sources).
ChatGPT is the editorial engine: 49.9% of its sources are publishers, review sites, and listicles, and it is the only engine that cites the Reddit-scraping aggregators gummysearch.com and redditrecs.com (100% of their citations), as well as cdc.gov and epa.gov for safety questions. It also cites nothing at all in 14.5% of answers, second only to Google AI Mode's 17.8%; ChatGPT's sourceless answers carry cards more often than its sourced ones (chapter 5). ChatGPT is the only engine whose sources carry publication dates (59.4%).
Perplexity sits between ChatGPT and Google AI Mode: 44.0% editorial, 18.9% community, and it owns alibaba.com (61% of that domain's citations in the study), nytimes.com (75%), and cnet.com (51%). It cites the most distinct domains per answer (8.7) and almost never cites nothing (0.1%). It is also the only engine that returns videos (1.2 per answer) and related-query suggestions (4.9 per answer).
4.3 What fills the cards
Figure 11. Card characteristics by engine: share of slots with a price, with a rating, held by the top ten brands, and held by the top three merchants.
Figure 12. Where the cards link to, by engine, with Study 1 for comparison.
Copilot's shelf is Amazon and Walmart: 25.2% of its card slots link to Amazon and 18.2% to Walmart, its top three merchants hold 47.5% of slots, and its products carry a median of 2,189 reviews, the heaviest of any engine. ChatGPT and Google AI Mode both lead with Walmart (11.0% and 11.2% of slots), then Best Buy and Target, with their top three merchants holding 24% to 25%. Perplexity's shelf is a different merchant network: 99.3% of its card URLs are Shopify-style store links, its top merchants are Electroeshop, PzDeals, Ysvara Lifestyle, and The Business End, its top ten merchants hold 16% of slots, 828 merchants fill 1,842 slots, 83.0% of its products show zero reviews, only 17.0% carry a rating, and 8.6% of its slots sit on non-US domains with prices labeled in dollars. Chapter 5 reports the non-US stores.
Prices follow the merchant network: median card price $46 on Copilot, $55 on ChatGPT, $62 on Google AI Mode, and $169 on Perplexity, where the non-US stores inflate the figure. Ratings are present on 73% of ChatGPT's cards, 69% of Copilot's, 38% of Google AI Mode's, and 17% of Perplexity's; where present, mean ratings are 4.50 to 4.62 on every engine.
4.4 Brands are portable, products are not
Figure 19. Where the twelve largest brands' card slots sit, by engine.
Table 7. Brand presence by engine, 25 largest brands by card slots.
| Brand | Card slots | Engines | Engine with most slots | Its share | Slots by engine |
|---|---|---|---|---|---|
| Samsung | 1,069 | 4 | Google AI Mode | 37.8% | Google AI Mode 404; Copilot 304; Perplexity 224; ChatGPT 137 |
| Apple | 730 | 4 | Google AI Mode | 59.3% | Google AI Mode 433; Copilot 166; ChatGPT 91; Perplexity 40 |
| Sony | 509 | 4 | Google AI Mode | 49.5% | Google AI Mode 252; Copilot 154; ChatGPT 68; Perplexity 35 |
| 466 | 4 | Google AI Mode | 53.6% | Google AI Mode 250; Copilot 120; ChatGPT 70; Perplexity 26 | |
| LG | 401 | 4 | Google AI Mode | 40.6% | Google AI Mode 163; Copilot 122; ChatGPT 58; Perplexity 58 |
| Lenovo | 320 | 4 | Google AI Mode | 39.4% | Google AI Mode 126; Copilot 101; ChatGPT 55; Perplexity 38 |
| Dell | 276 | 4 | Google AI Mode | 43.8% | Google AI Mode 121; Copilot 83; Perplexity 44; ChatGPT 28 |
| HP | 248 | 4 | Perplexity | 36.3% | Perplexity 90; Copilot 80; Google AI Mode 56; ChatGPT 22 |
| TCL | 246 | 4 | Google AI Mode | 48.4% | Google AI Mode 119; Copilot 66; ChatGPT 34; Perplexity 27 |
| CeraVe | 236 | 3 | Google AI Mode | 55.1% | Google AI Mode 130; Copilot 74; ChatGPT 32 |
| ASUS | 225 | 4 | Google AI Mode | 57.3% | Google AI Mode 129; ChatGPT 47; Copilot 40; Perplexity 9 |
| Nike | 218 | 3 | Google AI Mode | 48.2% | Google AI Mode 105; Copilot 83; ChatGPT 30 |
| Bose | 199 | 4 | Google AI Mode | 47.2% | Google AI Mode 94; Copilot 57; ChatGPT 33; Perplexity 15 |
| Brooks | 196 | 3 | Google AI Mode | 51.5% | Google AI Mode 101; Copilot 84; ChatGPT 11 |
| Meguiars | 182 | 3 | Google AI Mode | 63.7% | Google AI Mode 116; Copilot 36; ChatGPT 30 |
| HOKA | 179 | 3 | Google AI Mode | 43.6% | Google AI Mode 78; Copilot 72; ChatGPT 29 |
| Breville | 172 | 3 | Google AI Mode | 65.7% | Google AI Mode 113; Copilot 34; ChatGPT 25 |
| Gaiam | 169 | 4 | Google AI Mode | 46.7% | Google AI Mode 79; Copilot 69; ChatGPT 20; Perplexity 1 |
| Ninja | 165 | 3 | Google AI Mode | 53.3% | Google AI Mode 88; ChatGPT 44; Copilot 33 |
| Cuisinart | 161 | 3 | Google AI Mode | 50.3% | Google AI Mode 81; Copilot 42; ChatGPT 38 |
| Amazon | 159 | 4 | Google AI Mode | 50.9% | Google AI Mode 81; Copilot 63; ChatGPT 12; Perplexity 3 |
| Chemical Guys | 158 | 3 | Google AI Mode | 65.2% | Google AI Mode 103; Copilot 41; ChatGPT 14 |
| LEGO | 156 | 2 | Copilot | 73.7% | Copilot 115; ChatGPT 41 |
| adidas | 155 | 3 | Google AI Mode | 51.0% | Google AI Mode 79; Copilot 54; ChatGPT 22 |
| La Roche-Posay | 154 | 3 | Google AI Mode | 61.0% | Google AI Mode 94; Copilot 34; ChatGPT 26 |
Of 564 brands with at least ten card slots, only 10 appear on exactly one engine and 26 have 90% or more of their slots on one engine. Google AI Mode carries the largest share of nearly every major brand's slots (Apple 59%, ASUS 57%, Google 54%, Sony 50%, TCL 48%), because it shows the most cards. The exceptions are small: LEGO's slots are 74% on Copilot, HP's 36% on Perplexity. Brand presence is engine-portable; the individual product shown is not (section 3).
5. How Perplexity Searches
Table 8. Perplexity's search sub-queries, Study 2. Each Perplexity answer records the search queries the engine fired; 5,577 answers carry 7,519 of them.
| Measure | Value |
|---|---|
| Answers carrying search sub-queries | 5,577 |
| Sub-queries per answer (mean) | 1.35 |
| Sub-query identical to the question | 15.4% |
| Sub-query length as share of question length (median) | 31.8% |
| Sub-queries containing 'best' | 18.7% |
| Containing 'review' | 1.9% |
| Containing a year | 1.6% |
| Containing 'reddit' | 0.0% |
| Containing 'vs' | 13.2% |
| Containing 'top' | 1.1% |
| Containing 'under' | 5.9% |
| Containing 'cheap' | 1.1% |
| Intent stage | Sub-queries per answer | Adds 'best' | Adds a year |
|---|---|---|---|
| Problem Recognition | 1.32 | 21.3% | 2.6% |
| Category Exploration | 1.36 | 42.5% | 7.5% |
| Budget Framing | 1.34 | 53.8% | 2.0% |
| Attribute Constrained | 1.28 | 18.7% | 0.9% |
| Comparison | 1.50 | 7.6% | 1.0% |
| Validation / Risk Reduction | 1.41 | 1.4% | 1.8% |
| Scenario Confirmation | 1.29 | 37.4% | 0.1% |
| Purchase Execution | 1.26 | 25.0% | 0.3% |
| Post Purchase | 1.40 | 13.0% | 0.0% |
Figure 15. Words Perplexity adds when it rewrites a shopping question into a search.
Figure 16. Words Perplexity drops.
Figure 17. Share of answers where Perplexity's sub-query contains "best", by stage.
Figure 18. Keywords in Perplexity's related-query suggestions.
Perplexity fires 1.35 searches per shopping answer. Only 15.4% of those searches repeat the shopper's words; the median search is 31.8% of the question's length. It drops the first person and the narrative ("I", "my", "need", "want", "actually", "but") and adds the vocabulary of a comparison article: "best" (895 sub-queries), "vs" (747), "comparison" (242), "under" (165), "2026" (86), "review" (78), "durability", "effectiveness", "performance", "safety". The word "best" is added to 53.8% of Budget Framing searches, 42.5% of Category Exploration searches, and 1.4% of Validation searches: the engine reads a price cap as a request for a ranking.
Its 27,600 related-query suggestions lead with "best" (16.1% of suggestions), "how" (12.5%), "vs" (10.4%), "which" (6.6%), "under" (5.8%), and "budget" (3.8%). Taken together, the sub-queries and suggestions show what Perplexity thinks a shopping question is: a request for a listicle or a head-to-head, answered from editorial pages. This is consistent with its 5.0% card rate and its 44.0% editorial citation share.
6. Which ChatGPT Answered You
Table 9. Served model by stage and by phrasing style, Study 2 ChatGPT answers.
| Intent stage | gpt-5-3-mini | gpt-5-5 | gpt-5-3 | Share mini |
|---|---|---|---|---|
| Problem Recognition | 395 | 240 | 64 | 56.5% |
| Category Exploration | 415 | 199 | 59 | 61.7% |
| Budget Framing | 297 | 145 | 55 | 59.8% |
| Attribute Constrained | 410 | 196 | 53 | 62.2% |
| Comparison | 378 | 182 | 57 | 61.3% |
| Validation / Risk Reduction | 345 | 170 | 41 | 62.1% |
| Scenario Confirmation | 438 | 201 | 57 | 62.9% |
| Purchase Execution | 426 | 183 | 58 | 63.9% |
| Post Purchase | 268 | 166 | 64 | 53.8% |
| Style | gpt-5-3-mini | gpt-5-5 | gpt-5-3 | Share mini |
|---|---|---|---|---|
| Conversational | 867 | 421 | 118 | 61.7% |
| Long | 812 | 411 | 134 | 59.8% |
| Medium | 822 | 450 | 134 | 58.5% |
| Short | 871 | 400 | 122 | 62.5% |
Table 10. Product-card rate by served model and stage.
| Intent stage | gpt-5-3-mini | gpt-5-5 | gpt-5-3 |
|---|---|---|---|
| Problem Recognition | 0.3% | 30.4% | 73.4% |
| Category Exploration | 0.7% | 88.4% | 50.8% |
| Budget Framing | 12.8% | 97.9% | 100.0% |
| Attribute Constrained | 6.6% | 95.4% | 90.6% |
| Comparison | 0.3% | 78.0% | 73.7% |
| Validation / Risk Reduction | 0.0% | 32.9% | 58.5% |
| Scenario Confirmation | 0.5% | 80.6% | 93.0% |
| Purchase Execution | 12.7% | 83.1% | 77.6% |
| Post Purchase | 0.0% | 5.4% | 35.9% |
Figure 13. ChatGPT's product-card rate by served model and stage, with Study 1 for comparison.
Every ChatGPT answer in both studies returned the name of the model that produced it. In Study 2, 60.4% of ChatGPT's de-duplicated answers came from gpt-5-3-mini, 30.1% from gpt-5-5, and 9.1% from gpt-5-3. The routing did not depend on the question: each stage received 56% to 62% mini answers and each style 59% to 62% (Table 9). It depended on the collection day: all gpt-5-3 answers were collected on May 5 with the electronics batch, and the later days mixed the mini model and gpt-5-5.
The served model decided the shelf. gpt-5-3-mini showed a product card in 3.7% of answers (95% CI 3.1 to 4.4); gpt-5-5 in 65.3% (63.0 to 67.7); gpt-5-3 in 72.2% (68.3 to 76.0). The mini model's best stages, Budget Framing and Purchase Execution, reach 12.8% and 12.7%; it showed no card for any validation or post-purchase question. The full models match or exceed Study 1 at the top of the funnel (Budget 98% to 100%, Attribute 91% to 95%, Scenario 81% to 93%) and far exceed it at Comparison (74% to 78% against 15%) and Validation (33% to 59% against 8%). The published "ChatGPT 28.5%" is a weighted average of a text engine and a shopping engine.
The mini model differs in other ways too. It cites nothing in 17.4% of answers, asks a clarifying question in 51.5% (gpt-5-5 9.2%), names a single pick in 23.7% (gpt-5-5 51.9%), and names a retailer in 27.3% (gpt-5-5 57.6%). It is a text assistant for shopping; the full models are shopping assistants. In a model that predicts whether a ChatGPT answer carries a card, the served model is the single strongest feature in the entire study, with a permutation importance of 0.398, four times that of intent (chapter 4).
Figure 14. Ask the same question twice on the same engine: share of retry pairs with the same card outcome, and overlap of brands and products where both attempts showed cards.
Table 11. Re-ask consistency, Study 2 retry pairs.
| Engine | Retry pairs | Same outcome | Pairs with cards both times | Brand overlap | No brand in common | Product overlap | Cited-domain overlap | Word-count change (median) |
|---|---|---|---|---|---|---|---|---|
| Google AI Mode | 884 | 89.8% | 669 | 0.67 | 4.3% | 0.23 | 0.33 | 58 |
| Copilot | 879 | 75.4% | 339 | 0.49 | 14.2% | 0.13 | 0.30 | 61 |
| ChatGPT | 883 | 57.6% | 167 | 0.44 | 19.8% | 0.06 | 0.32 | 44 |
| Perplexity | 873 | 86.4% | 165 | 0.77 | 9.1% | 0.70 | 0.47 | 70 |
| ChatGPT, same model both times | 439 | 90.2% | 0.44 | |||||
| ChatGPT, model switched | 444 | 25.5% |
Study 2's 3,519 retry pairs, where the same question was sent to the same engine twice, are a free consistency test. Google AI Mode kept its card decision 89.8% of the time, Perplexity 86.4%, Copilot 75.4%, and ChatGPT 57.6%. ChatGPT's figure is two figures: 90.2% when the same model answered both times (439 pairs) and 25.5% when the model switched (444 pairs). Where both attempts showed cards, brand overlap was 0.44 (ChatGPT), 0.49 (Copilot), 0.67 (Google AI Mode), and 0.77 (Perplexity), and product overlap 0.06, 0.13, 0.23, and 0.70. Google AI Mode keeps its decision and re-picks its products; Perplexity, on the few electronics questions it cards, keeps both. Chapter 5 reports Study 1's duplicate-text pairs, which agree on the card decision 96.0% of the time (the February models were routed consistently) but share only 25% of brands and 6% of products.
7. ChatGPT Across the Two Studies
Figure 20. ChatGPT's product-card rate by stage: Study 1 (dresses, February 2026), Study 2 all ChatGPT answers, and Study 2 by full model.
Table 12. ChatGPT in Study 1 and Study 2 on comparable measures, with Study 2 split by served model.
| Measure | Study 1 (dresses, Feb 2026) | Study 2, all ChatGPT | Study 2, gpt-5-3-mini | Study 2, gpt-5-5 | Study 2, gpt-5-3 |
|---|---|---|---|---|---|
| Answers | 8,520 | 5,584 | 3,372 | 1,682 | 508 |
| Product-card rate | 59.5% | 28.5% | 3.7% | 65.3% | 72.2% |
| Products per card-bearing answer | 8.0 | 4.0 | 4.3 | 4.1 | 3.7 |
| Distinct brands per answer | 4.9 | 2.6 | 2.3 | 2.7 | 2.6 |
| Top-10 brand share of slots | 32.7% | 13.3% | 17.9% | 9.3% | 51.9% |
| Slots on a brand-owned store | 42.3% | 15.5% | 15.6% | 15.5% | 15.6% |
| Top merchant | Lulus | Walmart | Walmart | Walmart | Best Buy |
| Card price, median | $70 | $55 | $45 | $40 | $285 |
| Cards with a rating | 75.5% | 73.3% | 94.6% | 80.0% | 42.3% |
| Review count, median | 31 | 542 | 250 | 478 | 2,250 |
| Sources per answer | 20.9 | 11.8 | 10.1 | 15.8 | 9.8 |
| Answers citing no source | 3.5% | 14.5% | 17.4% | 4.0% | 26.2% |
| Citation pills per answer | 6.0 | 4.5 | 2.4 | 9.0 | 3.3 |
| Named entities per answer | 5.5 | 2.1 | 1.5 | 3.1 | 2.8 |
| Editorial share of sources | 46.0% | 49.9% | 56.8% | 40.9% | 51.1% |
| Retail share | 26.7% | 19.4% | 21.9% | 16.1% | 19.7% |
| Brand-owned share | 10.3% | 4.9% | 4.7% | 3.3% | 15.5% |
| Community share | 3.2% | 12.0% | 2.0% | 26.4% | 4.0% |
| reddit.com share | 1.1% | 7.5% | 0.4% | 17.5% | 3.3% |
| Words per answer (mean) | 400 | 417 | 398 | 447 | 457 |
| Hedging per 100 words | 0.63 | 0.86 | 0.93 | 0.84 | 0.46 |
| Asks a clarifying question | 66.1% | 37.4% | 51.5% | 9.2% | 39.0% |
| Names a single pick | 26.6% | 34.7% | 23.7% | 51.9% | 52.4% |
| Names a retailer | 47.8% | 39.4% | 27.3% | 57.6% | 60.8% |
Study 1's 59.5% and Study 2's 28.5% are two snapshots, three months apart, of different categories in different collection runs with different served models. Restricting Study 2 to its full models gives 66.9% across seven categories, seven points above Study 1, with the same stage order at the top. On that basis, four things carry over from the dresses study to the seven categories: the stage order at the top and bottom of the funnel; the single-pick habit (26.6% in Study 1, 52.0% on gpt-5-5); the share of cards with a rating (75% in Study 1, 80% on gpt-5-5; 42% on gpt-5-3, whose electronics cards often lack one); and the default to Walmart, Target, and Best Buy as hosts outside fashion.
Four things do not carry over. The shelf is half as deep (8.0 products per carousel in Study 1, 4.0 in Study 2). The share of slots on a brand-owned store falls from 42.3% to 15.5%: dresses are a direct-to-consumer category and electronics, health, and home are retailer categories. Reddit goes from 1.1% of Study 1's sources to 17.5% of gpt-5-5's. And the dresses carousel listed products with a median of 31 reviews, where Study 2's ChatGPT cards carry 542: the long tail of dress SKUs against the head of electronics and household SKUs.
8. Discussion
Four conclusions follow.
"AI visibility" is engine-specific at the question level, not just at the average. The platform rates (64.4%, 44.5%, 28.5%, 5.0%) are well known from the study's first publication; this chapter shows that behind them the engines agree on only 1.6% of questions and share almost none of the same products. A measurement program that samples one engine measures that engine.
Google AI Mode is the superset. Whatever ChatGPT, Copilot, or Perplexity cards, Google AI Mode cards 76% to 95% of the time, and it cards far more besides. For a brand with one engine to monitor, it is the one that contains the others.
Each engine has a web. The community web on Google AI Mode, the retail web on Copilot, the editorial web on ChatGPT and Perplexity. The same brand needs Reddit threads, Amazon listings, and review-site coverage to be cited on all three; no single asset is cited by all of them.
ChatGPT has to be measured by served model. The routing in May 2026 split one engine into a text assistant and a shopping assistant, and re-asking a question across the split changed the outcome three times in four. A ChatGPT visibility figure without its model is a routing figure.
9. Limitations Specific to This Chapter
- Agreement and overlap are computed on one collection window per engine. The engines were not queried at the same minute; same-day differences in each engine's index are inside the measurement.
- Product overlap uses normalized product titles (the first six words after removing colors and sizes). Identical products with differently formatted titles count as different; the true product overlap is somewhat higher than 0.01 to 0.05, but brand overlap, which does not have this problem, is only 0.25 to 0.42.
- ChatGPT's served model was observed, not controlled. The three models also differ in their collection days, so "model" and "day" are confounded for gpt-5-3; the mini and gpt-5-5 answers were collected on the same days and their contrast is clean.
- Perplexity's sub-queries and related queries are reported as captured from the answer page; how the engine uses them internally is not observed.
- Study 1 and Study 2 are compared on definitions, not on levels (hub, section 3.6).
Navigation. Previous: Chapter 1. The nine shopping intents · Next: Chapter 3. Visibility by category · AI Shopping Visibility Study 2026 (hub, abstract, and all chapters).
About the author. Vijaya Kumar Channalli is a serial SaaS founder and the founder of AEOsome (Tartu, Estonia), which helps eCommerce brands get their products recommended when shoppers ask AI what to buy. Read how we write, source and correct posts in our editorial policy.
Sources: AEOsome Research, AI Shopping Visibility Study 2026, chapter 2. Study 2: 22,335 de-duplicated answers across ChatGPT, Google AI Mode, Microsoft Copilot, and Perplexity, seven categories, United States, May 5 to May 14, 2026; 5,583 questions answered on all four engines; 3,519 retry pairs. Study 1: 8,520 ChatGPT answers, women's dresses, United States, February 28 to March 1, 2026. Hub: https://www.aeosome.com/blog/research/ai-shopping-visibility-study-2026/