Chapter 4. What Predicts Whether an AI Engine Shows Your Product? Platform, Intent, Wording, Reviews, and the Served Model, Modelled
Chapter 4 of the AI Shopping Visibility Study 2026. Logistic and gradient-boosting models of when a product card appears on ChatGPT, Google AI Mode, Copilot and Perplexity; which brands reach ChatGPT's carousel; what takes rank one inside a carousel; confidence intervals and multiple-comparison test

AEOsome Research. Vijaya Kumar Channalli. Chapter 4 of the AI Shopping Visibility Study 2026, version 2026-10. The hub carries the abstract, the ten findings, the methods summary, and the other chapters. This chapter reports the predictive models.
Abstract
Chapters 1 to 3 tabulate product-card rates by stage, engine, and category one dimension at a time. This chapter fits models that hold the dimensions together and asks what each one adds. Three targets are modelled. First, whether an answer carries a product card: in Study 1 (8,520 ChatGPT answers, women's dresses) intent stage and phrasing style predict a carousel with an out-of-sample AUC of 0.947, and 23 engine-tagged query signals add nothing to that; in Study 2 (22,335 de-duplicated answers, four engines, seven categories) the platform alone predicts a card better than intent, category, style, and wording combined, and on ChatGPT the served model is the strongest single feature in the study. Second, whether a given brand reaches ChatGPT's carousel: for the leading direct-to-consumer dress brands the question's features barely move the odds (AUC 0.53 to 0.62), while a retailer host like Walmart is predictable from the price cap and the stage (AUC 0.70). Third, which product takes rank one inside a carousel: on ChatGPT, rating and review count predict position and price does not; on Google AI Mode review count alone; on Copilot nothing measured. The chapter closes with bootstrap intervals for every headline rate and a Bonferroni test of all 36 pairwise stage differences in Study 2, of which 31 survive.
1. Scope and Methods
Targets. (a) Product card shown (yes/no) per answer. (b) Brand present in the carousel (yes/no) per card-bearing Study 1 answer, for eight brands and hosts. (c) Product holds rank one (yes/no) per product inside a carousel.
Features for (a). Intent stage (9), phrasing style (5 in Study 1, 4 in Study 2), platform (Study 2), category (Study 2), served model (ChatGPT), the 23 engine-tagged query signals where present (all of Study 1; six of Study 2's seven categories), and 14 wording features computed identically on both studies: word count, question mark, wh-word opening, and the presence of price, compare, deal, urgency, buy, "best", problem, and use-case words, all-lowercase phrasing, and missing end punctuation.
Models. A logistic regression (interpretable odds ratios with 95% confidence intervals) and a gradient-boosted classifier (non-linear, for predictive power and feature importance), both evaluated out of sample with 5-fold cross-validation. In Study 2 the folds are grouped by question so that the same question never appears in both the training and the test sets across platforms. Feature importance is permutation importance: the AUC lost when one feature's values are shuffled, averaged over five repeats. AUC is the area under the ROC curve on held-out data; 0.5 is chance and 1.0 is perfect.
Features for (c). Each product is compared only with its carousel mates: its price, rating, and review count standardized within the carousel, flags for being the cheapest, the priciest, the top-rated, or the most-reviewed in its carousel, whether it carries a rating, and log review count. Folds are grouped by carousel.
Confidence. Every rate in this chapter carries a Wilson or bootstrap interval; every model reports its out-of-sample AUC; stage differences are tested with a Bonferroni correction. Definitions of product card, brand, and confidence labels are in the hub and chapter 7.
2. What Predicts a Product Card
Figure 1. Out-of-sample AUC of each model. Study 1's models predict better than Study 2's because Study 1 has one engine and one category; Study 2's platform-only model beats everything except the per-engine models.
Table 1. Model performance.
| Model | n | Base rate | Logistic AUC | Gradient-boosting AUC | Average precision | Pseudo-R² |
|---|---|---|---|---|---|---|
| Study 1: intent + style + model + 23 tags + 14 wording features | 8,520 | 59.5% | 0.922 | 0.943 | 0.960 | 0.48 |
| Study 1: intent only | 8,520 | 59.5% | 0.858 | 0.858 | 0.867 | 0.36 |
| Study 1: tags + wording, no intent | 8,520 | 59.5% | 0.880 | 0.918 | 0.942 | 0.37 |
| Study 1: intent + style + wording, no tags | 8,520 | 59.5% | 0.922 | 0.947 | 0.963 | 0.48 |
| Study 2: platform + category + intent + style + wording | 22,335 | 35.6% | 0.828 | 0.858 | 0.758 | 0.27 |
| Study 2: platform only | 22,335 | 35.6% | 0.761 | 0.761 | 0.577 | 0.18 |
| Study 2: intent only | 22,335 | 35.6% | 0.639 | 0.639 | 0.463 | 0.05 |
| Study 2: category only | 22,335 | 35.6% | 0.574 | 0.574 | 0.421 | 0.02 |
| Study 2: everything except platform | 22,335 | 35.6% | 0.673 | 0.685 | 0.531 | 0.07 |
| Study 2, ChatGPT only (with served model) | 5,584 | 28.5% | 0.955 | 0.962 | 0.914 | 0.59 |
| Study 2, Google AI Mode only | 5,584 | 64.4% | 0.783 | 0.788 | 0.852 | 0.20 |
| Study 2, Copilot only | 5,583 | 44.5% | 0.711 | 0.720 | 0.655 | 0.12 |
| Study 2, Perplexity only | 5,584 | 5.0% | 0.976 | 0.967 | 0.681 | 0.68 |
| Study 2, six categories with tags | 18,736 | 32.8% | 0.847 | 0.864 | 0.743 | — |
| Study 2, ChatGPT full models only | 2,190 | 66.9% | 0.866 | 0.889 | 0.938 | 0.36 |
2.1 Study 1: intent and style explain the engine-tagged signals
Figure 2. Permutation importance in the Study 1 full model.
Table 2. Study 1 permutation importances, top 20.
| Feature | AUC lost when shuffled | ± std |
|---|---|---|
| intent stage | 0.2243 | 0.0031 |
| phrasing style | 0.0861 | 0.0021 |
| problem signal (tag) | 0.0597 | 0.0022 |
| query length (tag) | 0.0325 | 0.0010 |
| starts with wh-word | 0.0136 | 0.0004 |
| word count | 0.0098 | 0.0007 |
| price words | 0.0091 | 0.0006 |
| buy words | 0.0074 | 0.0005 |
| attribute count (tag) | 0.0058 | 0.0002 |
| 'best' words | 0.0057 | 0.0005 |
| use-case words | 0.0045 | 0.0004 |
| ambiguity score (tag) | 0.0039 | 0.0001 |
| problem words | 0.0037 | 0.0002 |
| purchase signal (tag) | 0.0033 | 0.0002 |
| served model | 0.0033 | 0.0002 |
| use case (tag) | 0.0028 | 0.0002 |
| conversational tone (tag) | 0.0026 | 0.0002 |
| audience specified (tag) | 0.0025 | 0.0002 |
| question format (tag) | 0.0024 | 0.0004 |
| price mentioned (tag) | 0.0019 | 0.0002 |
The full Study 1 model reaches AUC 0.943 (gradient boosting) and 0.922 (logistic). Intent stage carries most of it (importance 0.224), style second (0.086), then the problem-language tag (0.060) and query length (0.033); every other feature is below 0.015. Two nested models make the point. Dropping all 23 engine-tagged signals and keeping intent, style, and the 14 wording features gives AUC 0.947, the same as the full model. Dropping intent instead and keeping the tags costs 0.03 of AUC, and the features that step in are brand-named, query length, problem signal, and conversational tone: proxies for the stage and the style. The published binary-signal effects for Study 1 (deal-seeking 92.5% against 57.5%, urgency 90.2% against 57.0%, and so on) are real as marginal rates and are the intent table in disguise: deal and urgency language are features of Budget and Purchase questions, problem language of Problem Recognition questions, brand and comparison language of Comparison and Validation questions. Confirmed.
Table 6. Study 1 logistic model: odds ratios for the significant and near-significant terms (reference: Attribute Constrained stage, Conversational style). Two collinear length terms are omitted from the table.
| Term | Odds ratio | 95% CI | p |
|---|---|---|---|
| Validation / Risk Reduction | 0.02 | 0.01 to 0.03 | <0.001 |
| style: Short | 55.53 | 29.67 to 103.92 | <0.001 |
| style: Medium | 45.55 | 24.62 to 84.28 | <0.001 |
| style: Long | 9.48 | 6.47 to 13.90 | <0.001 |
| price words | 1.74 | 1.53 to 1.97 | <0.001 |
| starts wh | 0.76 | 0.69 to 0.83 | <0.001 |
| usecase words | 1.23 | 1.14 to 1.32 | <0.001 |
| buy words | 1.45 | 1.20 to 1.74 | <0.001 |
| problem words | 0.88 | 0.82 to 0.94 | <0.001 |
| Purchase Execution | 2.05 | 1.17 to 3.60 | 0.012 |
| best words | 1.09 | 1.01 to 1.18 | 0.032 |
| sig Brand Mentioned | 1.17 | 0.98 to 1.39 | 0.081 |
| sig Contains Time Context | 1.19 | 0.96 to 1.48 | 0.119 |
| sig Ambiguity Score | 0.84 | 0.65 to 1.07 | 0.159 |
| Category Exploration | 1.22 | 0.90 to 1.64 | 0.200 |
| sig Attribute Count | 0.87 | 0.71 to 1.07 | 0.201 |
| Scenario Confirmation | 1.20 | 0.91 to 1.60 | 0.202 |
| urgent words | 0.86 | 0.69 to 1.09 | 0.210 |
| sig Price Mentioned | 0.93 | 0.82 to 1.05 | 0.249 |
| sig Deal Seeking Signal | 1.06 | 0.96 to 1.16 | 0.265 |
| sig Purchase Explicit Signal | 0.88 | 0.70 to 1.11 | 0.279 |
| sig Conversational Tone | 0.88 | 0.69 to 1.11 | 0.281 |
| sig Use Case Mentioned | 0.95 | 0.84 to 1.07 | 0.375 |
| compare words | 1.03 | 0.96 to 1.11 | 0.409 |
Figure 10. Study 1: odds of a carousel by wording and style, relative to Conversational phrasing. Short and Medium phrasing multiply the odds by 46 to 56; Long by 9.5. Style effects are capped at 5× in the chart for display.
Holding the stage fixed, the wording that matters in Study 1 is a stated price or price word (odds ratio 1.74, 95% CI 1.54 to 1.97), buy or order language (1.45), a use case (1.23), and "best, top, recommend" (1.09); a wh-word opening (0.76) and problem language (0.88) reduce the odds. The style terms dwarf them: Short 55.5, Medium 45.5, Long 9.5 relative to Conversational, the collapse reported in chapter 1.
2.2 Study 2: platform first, then intent, then category
Figure 3. Permutation importance in the Study 2 full model.
Table 3. Study 2 permutation importances.
| Feature | AUC lost when shuffled | ± std |
|---|---|---|
| platform | 0.2694 | 0.0030 |
| intent stage | 0.0897 | 0.0006 |
| category | 0.0695 | 0.0003 |
| word count | 0.0139 | 0.0005 |
| 'best' words | 0.0073 | 0.0006 |
| starts with wh-word | 0.0046 | 0.0002 |
| buy words | 0.0039 | 0.0003 |
| all lowercase | 0.0036 | 0.0002 |
| phrasing style | 0.0024 | 0.0002 |
| problem words | 0.0021 | 0.0003 |
| urgency words | 0.0021 | 0.0004 |
| compare words | 0.0019 | 0.0002 |
| deal words | 0.0010 | 0.0001 |
| price words | 0.0007 | 0.0001 |
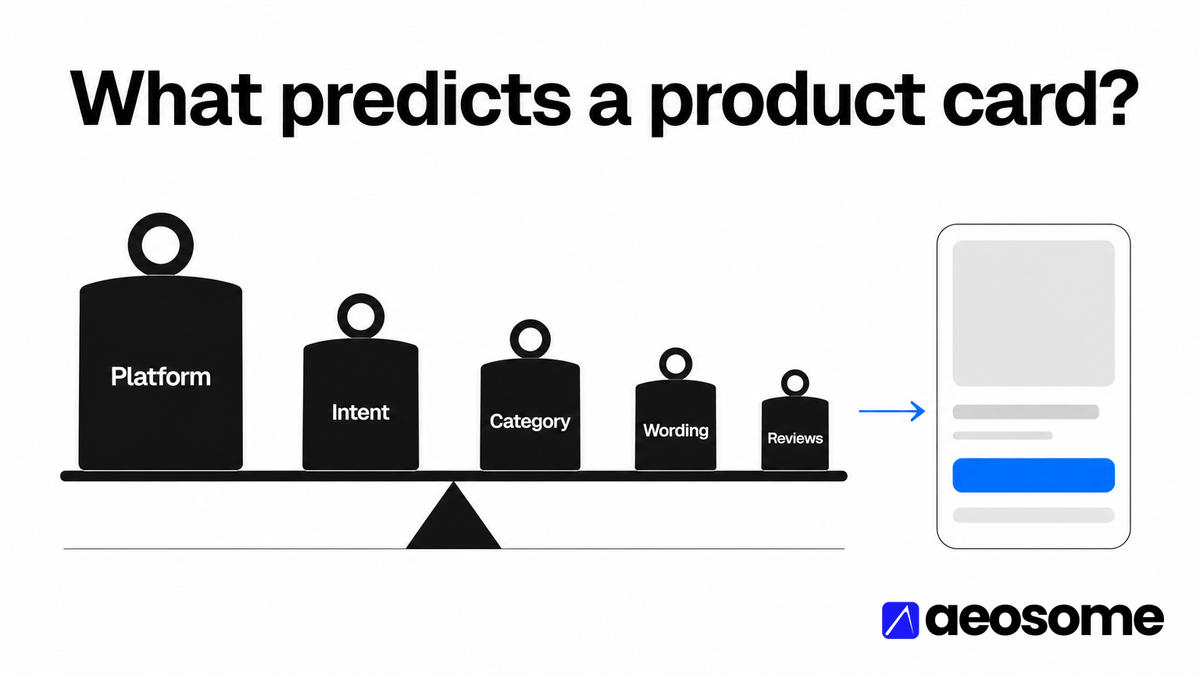
The Study 2 full model reaches AUC 0.858 (gradient boosting) and 0.828 (logistic), with platform at importance 0.269, intent 0.090, category 0.069, and word count 0.014; no wording feature exceeds 0.007. The nested models rank the dimensions cleanly: platform alone AUC 0.761; everything except platform 0.685; intent alone 0.639; category alone 0.574. Platform explains more of the card decision than intent, category, style, and wording combined. Confirmed.
Table 5. Study 2 logistic model: odds ratios (reference: ChatGPT, Auto, Attribute Constrained, Conversational phrasing).
| Term | Odds ratio | 95% CI | p |
|---|---|---|---|
| Google AI Mode | 5.92 | 5.44 to 6.44 | <0.001 |
| Perplexity | 0.11 | 0.09 to 0.12 | <0.001 |
| Post Purchase | 0.11 | 0.09 to 0.13 | <0.001 |
| Problem Recognition | 0.20 | 0.18 to 0.23 | <0.001 |
| Copilot | 2.26 | 2.08 to 2.46 | <0.001 |
| Electronics | 3.50 | 3.02 to 4.05 | <0.001 |
| Validation / Risk Reduction | 0.32 | 0.28 to 0.37 | <0.001 |
| best words | 1.24 | 1.20 to 1.29 | <0.001 |
| Category Exploration | 0.50 | 0.44 to 0.56 | <0.001 |
| Sports | 1.73 | 1.53 to 1.97 | <0.001 |
| Beauty | 1.63 | 1.44 to 1.84 | <0.001 |
| starts wh | 0.87 | 0.83 to 0.90 | <0.001 |
| Purchase Execution | 0.52 | 0.44 to 0.62 | <0.001 |
| Scenario Confirmation | 0.64 | 0.57 to 0.73 | <0.001 |
| Comparison | 0.62 | 0.52 to 0.72 | <0.001 |
| compare words | 0.91 | 0.87 to 0.95 | <0.001 |
| tokens | 0.87 | 0.82 to 0.94 | <0.001 |
| buy words | 1.09 | 1.04 to 1.14 | <0.001 |
| urgent words | 1.07 | 1.03 to 1.12 | <0.001 |
| all lower | 0.91 | 0.87 to 0.96 | <0.001 |
| problem words | 0.94 | 0.91 to 0.97 | <0.001 |
| style: Short | 1.22 | 1.08 to 1.37 | <0.001 |
| style: Medium | 1.16 | 1.05 to 1.28 | 0.004 |
| usecase words | 1.04 | 1.01 to 1.08 | 0.012 |
| Budget Framing | 1.24 | 1.04 to 1.49 | 0.019 |
| Health | 1.15 | 1.02 to 1.29 | 0.021 |
| Home | 1.14 | 0.99 to 1.32 | 0.062 |
| style: Long | 1.10 | 0.99 to 1.23 | 0.075 |
| Toys | 1.13 | 0.98 to 1.31 | 0.080 |
| price words | 1.02 | 0.98 to 1.07 | 0.326 |
Figure 8 (two panels). Study 2: odds of a product card by platform and category (relative to ChatGPT and Auto), and by intent stage (relative to Attribute Constrained).
Figure 9. Study 2: odds of a product card by wording and style, significant terms only, relative to Conversational phrasing.
Relative to ChatGPT, Google AI Mode multiplies the odds of a card by 5.9 (95% CI 5.4 to 6.4), Copilot by 2.3, and Perplexity by 0.11. Relative to Auto, Electronics multiplies them by 3.5, Sports by 1.7, Beauty by 1.6. Relative to Attribute Constrained, Post Purchase is 0.11, Problem Recognition 0.20, Validation 0.32, Category Exploration 0.50, Comparison 0.62, Scenario 0.64, Purchase 0.52, Budget Framing 1.24. Wording effects are small and in the same directions as Study 1: "best" 1.24, buy words 1.09, urgency words 1.08, use-case words 1.04; a wh-word opening 0.87, compare words 0.91, problem words 0.94, all-lowercase phrasing 0.91, and longer questions 0.87 per standard deviation of word count. Short and Medium phrasing are 1.22 and 1.16 relative to Conversational; Long is within noise of it.
2.3 Per-engine models: the served model, and where wording matters
Figure 4. ChatGPT only, Study 2: permutation importance. The served model is four times intent.
Figure 5. Google AI Mode only.
Figure 6. Copilot only.
Figure 7. Perplexity only.
Table 4. Permutation importances by engine, Study 2.
| Feature | ChatGPT | Google AI Mode | Copilot | Perplexity |
|---|---|---|---|---|
| served model | 0.3980 | — | — | — |
| category | 0.0269 | 0.1100 | 0.1504 | 0.2693 |
| intent stage | 0.0817 | 0.2243 | 0.1647 | 0.0473 |
| word count | 0.0201 | 0.0777 | 0.1027 | 0.0127 |
| phrasing style | 0.0042 | 0.0159 | 0.0303 | 0.0023 |
| buy words | 0.0039 | 0.0049 | 0.0257 | 0.0019 |
| 'best' words | 0.0044 | 0.0208 | 0.0175 | 0.0025 |
| all lowercase | 0.0039 | 0.0190 | 0.0128 | 0.0016 |
| problem words | 0.0026 | 0.0117 | 0.0111 | 0.0003 |
| urgency words | 0.0010 | 0.0047 | 0.0088 | 0.0005 |
| starts with wh-word | 0.0026 | 0.0087 | 0.0078 | 0.0016 |
| deal words | 0.0018 | 0.0033 | 0.0070 | 0.0016 |
| use-case words | 0.0006 | 0.0064 | 0.0023 | 0.0004 |
| price words | 0.0008 | 0.0059 | 0.0061 | 0.0023 |
On ChatGPT the served model has importance 0.398, four times intent (0.082) and fifteen times category (0.027); the ChatGPT-only model reaches AUC 0.962 for that reason. Remove the mini-model answers and the model looks like Study 1's: intent first (0.349), category second (0.084), word count third (0.070), AUC 0.889. On Perplexity the only thing that matters is whether the question is electronics (category 0.269; intent 0.047). Google AI Mode and Copilot are the engines where question wording has measurable importance (word count 0.078 and 0.103; "best", lowercase phrasing, buy words, problem words each 0.01 to 0.03): they are the least deterministic engines and the most sensitive to how the question is phrased. The six-category model with the engine-tagged signals (AUC 0.864) puts the tags below word count; attribute count and brand-named are the highest tags at 0.006 each.
3. Which Brands Reach ChatGPT's Carousel
Table 7. Brand-in-carousel models, Study 1 (among the 5,070 carousels). Macy's and Walmart are hosts, not brands.
| Brand or host | Carousels with it | Share of carousels | Model AUC | Best stage | Price mentioned | No price mentioned | By price cap |
|---|---|---|---|---|---|---|---|
| Lulus | 1,528 | 30.1% | 0.57 | Scenario Confirmation (35.0%) | 31.4% | 28.8% | up to $50 16.1%; $50 to $100 35.5%; $100 to $150 39.6%; $150 to $250 32.9%; over $250 34.5% |
| Petal & Pup | 1,071 | 21.1% | 0.57 | Category Exploration (26.2%) | 23.0% | 19.2% | up to $50 8.9%; $50 to $100 15.9%; $100 to $150 36.6%; $150 to $250 28.3%; over $250 27.7% |
| Old Navy | 790 | 15.6% | 0.62 | Category Exploration (22.0%) | 17.4% | 13.7% | up to $50 21.2%; $50 to $100 27.7%; $100 to $150 19.0%; $150 to $250 13.1%; over $250 10.1% |
| Fashion Nova | 714 | 14.1% | 0.59 | Budget Framing (20.8%) | 16.8% | 11.3% | up to $50 30.2%; $50 to $100 24.6%; $100 to $150 9.2%; $150 to $250 10.1%; over $250 10.5% |
| Quince | 662 | 13.1% | 0.57 | Problem Recognition (20.9%) | 10.6% | 15.5% | up to $50 6.0%; $50 to $100 9.1%; $100 to $150 14.6%; $150 to $250 12.3%; over $250 11.8% |
| H&M | 618 | 12.2% | 0.56 | Category Exploration (19.1%) | 11.8% | 12.6% | up to $50 17.3%; $50 to $100 13.2%; $100 to $150 10.7%; $150 to $250 8.3%; over $250 9.8% |
| Macy's | 1,408 | 27.8% | 0.53 | Category Exploration (32.6%) | 27.8% | 27.8% | up to $50 13.9%; $50 to $100 24.0%; $100 to $150 27.4%; $150 to $250 36.6%; over $250 33.9% |
| Walmart | 827 | 16.3% | 0.70 | Post Purchase (91.7%) | 23.1% | 9.6% | up to $50 54.4%; $50 to $100 33.9%; $100 to $150 13.1%; $150 to $250 7.9%; over $250 9.2% |
Figure 11. Share of carousels containing the brand, by stage: Lulus, Petal & Pup, Old Navy, Fashion Nova.
Figure 12. Share of carousels containing the brand or host, by stage: Quince, H&M, Macy's, Walmart.
Figure 13. Share of capped-question carousels containing the brand or host, by price cap.
Which brand fills a carousel is mostly not predictable from the question. For the direct-to-consumer dress brands the models reach AUC 0.53 to 0.62: Lulus is in 29% to 35% of carousels at every shopping stage and Petal & Pup in 15% to 26%, whatever the question's stage, style, or signals. The exception is Walmart as a host (AUC 0.70): it is the shelf for caps of $50 or less (54% of those carousels) and for post-purchase accessories (92% of twelve carousels), and nearly absent from unconstrained browsing (5%). Price caps sort the shelf by tier. Fashion Nova and Old Navy own caps up to $50 (30% and 21%); Lulus, Petal & Pup, and Macy's peak at $100 to $250 (33% to 40%); Quince, the quality-positioned brand, is the only one that appears less often when a price is mentioned (10.6% against 15.5%). In every brand model the most important feature is query length (0.14 to 0.20), then intent and attribute count: short, specific questions get the large direct-to-consumer catalogs, long narrative ones get department stores. Confirmed for the shelf shares; the models themselves are the finding, in that they barely beat chance.
4. Rank One Inside the Carousel
Figure 14. Share of carousels in which the cheapest, priciest, top-rated, or most-reviewed product holds position one, against the base rate.
Figure 15. Odds of rank one per within-carousel standard deviation of rating, review count, and price, and for the cheapest product and for carrying a rating.
Table 8. Rank-one models by engine.
| Slice | Products | Carousels | Base P(rank 1) | AUC | If cheapest | If priciest | If top-rated | If most-reviewed | If unrated | OR rating (per SD) | OR reviews | OR price | OR cheapest | OR has rating |
|---|---|---|---|---|---|---|---|---|---|---|---|---|---|---|
| ChatGPT (Study 1) | 40,540 | 5,070 | 12.5% | 0.755 | 9.4% | 17.9% | 18.6% | 33.1% | 7.0% | 2.12 | 1.69 | 1.38 | 0.85 | 0.97 |
| ChatGPT (Study 2) | 5,949 | 1,344 | 22.6% | 0.624 | 16.8% | 27.4% | 26.0% | 34.3% | 20.3% | 1.21 | 1.29 | 1.19 | 0.78 | 0.84 |
| Google AI Mode | 18,350 | 2,888 | 15.7% | 0.668 | 9.8% | 12.2% | 12.9% | 12.0% | 18.4% | 1.05 | 1.72 | 1.01 | 0.64 | 0.68 |
| Copilot | 14,372 | 2,384 | 16.6% | 0.555 | 20.9% | 18.9% | 19.5% | 21.4% | 16.2% | 1.03 | 1.06 | 0.97 | 1.45 | 0.81 |
Inside ChatGPT's eight-slot carousel in Study 1, the rank-one model reaches AUC 0.755 on 40,540 products in 5,070 carousels. The most-reviewed product in a carousel takes position one 33.1% of the time, 2.6 times the 12.5% base rate; the top-rated 18.6%; the priciest 17.9%; the cheapest 9.4%, below base; an unrated product 7.0%. Per within-carousel standard deviation, rating multiplies the odds of rank one by 2.12, review count by 1.69, and price by 1.38, in the direction of the pricier product. ChatGPT in Study 2 shows the same shape with less power (AUC 0.624; most-reviewed 34.3%, cheapest 16.8%; odds ratios 1.21, 1.29, 1.19).
Google AI Mode orders by review count (odds ratio 1.72 per standard deviation) and penalizes the cheapest product (0.64) and unrated products (0.68); rating itself adds little (1.05). Copilot's order is not predictable from price, rating, or reviews: AUC 0.555, every odds ratio between 0.97 and 1.45, and the cheapest product takes rank one 20.9% of the time against a 16.6% base rate, the only engine where cheapest helps. Confirmed for ChatGPT in Study 1 and for the null result on Copilot; Suggestive for the Study 2 ChatGPT and Google AI Mode effects.
The result reframes a claim AEOsome published earlier, that "average rating predicts carousel rank better than brand recognition". Rating predicts position inside a carousel. It does not predict presence across carousels: across the 110 Study 1 brands with at least 50 slots, the correlation between a brand's average rating and the number of carousels it appears in is negative (Spearman −0.24). Quince, rated 4.74, is in 13% of carousels; Lulus, rated 4.30, in 30%. Rating helps a product lead a shelf it is already on; it does not get a brand onto more shelves. Chapter 6 records the correction.
5. Intervals and Multiple Comparisons
Table 9. 95% bootstrap intervals for the headline rates (1,000 resamples).
| Slice | Rate | 95% bootstrap CI | n |
|---|---|---|---|
| Study 2, ChatGPT | 28.5% | 27.3 to 29.7 | 5,584 |
| Study 2, Perplexity | 5.0% | 4.5 to 5.6 | 5,584 |
| Study 2, Google AI Mode | 64.4% | 63.2 to 65.7 | 5,584 |
| Study 2, Copilot | 44.5% | 43.3 to 45.7 | 5,583 |
| Study 2, Post Purchase | 14.7% | 13.1 to 16.2 | 1,999 |
| Study 1, Post Purchase | 2.8% | 1.4 to 4.4 | 427 |
| Study 2, Purchase Execution | 43.0% | 41.1 to 44.8 | 2,672 |
| Study 1, Purchase Execution | 93.0% | 91.1 to 94.7 | 900 |
| Study 2, Comparison | 35.7% | 33.9 to 37.6 | 2,484 |
| Study 1, Comparison | 15.3% | 13.0 to 17.6 | 900 |
| Study 2, Category Exploration | 37.8% | 36.1 to 39.6 | 2,704 |
| Study 1, Category Exploration | 72.2% | 69.2 to 75.0 | 900 |
| Study 2, Scenario Confirmation | 39.6% | 37.7 to 41.4 | 2,784 |
| Study 1, Scenario Confirmation | 80.8% | 78.5 to 82.8 | 1,253 |
| Study 2, Budget Framing | 54.8% | 52.6 to 56.9 | 2,000 |
| Study 1, Budget Framing | 88.8% | 86.9 to 90.6 | 1,080 |
| Study 2, Problem Recognition | 20.4% | 18.9 to 22.0 | 2,800 |
| Study 1, Problem Recognition | 39.8% | 36.8 to 43.0 | 900 |
| Study 2, Validation / Risk Reduction | 26.2% | 24.6 to 28.2 | 2,240 |
| Study 1, Validation / Risk Reduction | 8.3% | 6.6 to 10.1 | 900 |
| Study 2, Attribute Constrained | 47.0% | 44.9 to 48.7 | 2,652 |
| Study 1, Attribute Constrained | 81.8% | 79.7 to 83.9 | 1,260 |
| Study 2, Electronics | 50.3% | 48.8 to 51.9 | 3,599 |
| Study 2, Auto | 28.7% | 27.2 to 30.1 | 3,600 |
| Study 2, Beauty | 35.9% | 34.4 to 37.4 | 3,600 |
| Study 2, Health | 30.1% | 28.7 to 31.6 | 3,600 |
| Study 2, Home | 31.4% | 29.5 to 33.3 | 2,216 |
| Study 2, Sports | 37.8% | 36.2 to 39.2 | 3,600 |
| Study 2, Toys | 31.9% | 29.8 to 34.0 | 2,120 |
| Study 2, ChatGPT served model gpt-5-3-mini | 3.7% | 3.1 to 4.4 | 3,372 |
| Study 2, ChatGPT served model gpt-5-5 | 65.3% | 63.0 to 67.7 | 1,682 |
| Study 2, ChatGPT served model gpt-5-3 | 72.2% | 68.3 to 76.0 | 508 |
Platform rates carry intervals of about ±1.2 points, Study 2 stage and category rates ±1.5 to ±2.1, Study 1 stage rates ±1.6 to ±3.1 (Post Purchase 1.4 to 4.8). ChatGPT's served-model rates: mini 3.1 to 4.4, gpt-5-5 63.0 to 67.7, gpt-5-3 68.3 to 76.0. Every headline gap in the study is at least ten times its interval.
Table 10. All 36 pairwise stage differences in Study 2, two-proportion z-tests with Bonferroni correction.
| Stage A | Stage B | Rate A | Rate B | Difference (points) | p | Significant after Bonferroni (36 tests) |
|---|---|---|---|---|---|---|
| Budget Framing | Post Purchase | 54.8% | 14.7% | +40.1 | <0.001 | yes |
| Budget Framing | Problem Recognition | 54.8% | 20.4% | +34.4 | <0.001 | yes |
| Attribute Constrained | Post Purchase | 47.0% | 14.7% | +32.3 | <0.001 | yes |
| Attribute Constrained | Problem Recognition | 47.0% | 20.4% | +26.6 | <0.001 | yes |
| Post Purchase | Purchase Execution | 14.7% | 43.0% | -28.4 | <0.001 | yes |
| Budget Framing | Validation / Risk Reduction | 54.8% | 26.2% | +28.5 | <0.001 | yes |
| Post Purchase | Scenario Confirmation | 14.7% | 39.6% | -24.9 | <0.001 | yes |
| Problem Recognition | Purchase Execution | 20.4% | 43.0% | -22.6 | <0.001 | yes |
| Category Exploration | Post Purchase | 37.8% | 14.7% | +23.2 | <0.001 | yes |
| Comparison | Post Purchase | 35.7% | 14.7% | +21.1 | <0.001 | yes |
| Problem Recognition | Scenario Confirmation | 20.4% | 39.6% | -19.2 | <0.001 | yes |
| Attribute Constrained | Validation / Risk Reduction | 47.0% | 26.2% | +20.7 | <0.001 | yes |
| Category Exploration | Problem Recognition | 37.8% | 20.4% | +17.4 | <0.001 | yes |
| Budget Framing | Comparison | 54.8% | 35.7% | +19.0 | <0.001 | yes |
| Comparison | Problem Recognition | 35.7% | 20.4% | +15.3 | <0.001 | yes |
| Purchase Execution | Validation / Risk Reduction | 43.0% | 26.2% | +16.8 | <0.001 | yes |
| Budget Framing | Category Exploration | 54.8% | 37.8% | +16.9 | <0.001 | yes |
| Budget Framing | Scenario Confirmation | 54.8% | 39.6% | +15.2 | <0.001 | yes |
| Scenario Confirmation | Validation / Risk Reduction | 39.6% | 26.2% | +13.3 | <0.001 | yes |
| Post Purchase | Validation / Risk Reduction | 14.7% | 26.2% | -11.6 | <0.001 | yes |
| Category Exploration | Validation / Risk Reduction | 37.8% | 26.2% | +11.6 | <0.001 | yes |
| Attribute Constrained | Comparison | 47.0% | 35.7% | +11.3 | <0.001 | yes |
| Budget Framing | Purchase Execution | 54.8% | 43.0% | +11.7 | <0.001 | yes |
| Comparison | Validation / Risk Reduction | 35.7% | 26.2% | +9.5 | <0.001 | yes |
| Attribute Constrained | Category Exploration | 47.0% | 37.8% | +9.2 | <0.001 | yes |
| Attribute Constrained | Scenario Confirmation | 47.0% | 39.6% | +7.4 | <0.001 | yes |
| Comparison | Purchase Execution | 35.7% | 43.0% | -7.3 | <0.001 | yes |
| Attribute Constrained | Budget Framing | 47.0% | 54.8% | -7.8 | <0.001 | yes |
| Post Purchase | Problem Recognition | 14.7% | 20.4% | -5.7 | <0.001 | yes |
| Problem Recognition | Validation / Risk Reduction | 20.4% | 26.2% | -5.9 | <0.001 | yes |
| Category Exploration | Purchase Execution | 37.8% | 43.0% | -5.2 | <0.001 | yes |
| Comparison | Scenario Confirmation | 35.7% | 39.6% | -3.9 | 0.004 | no |
| Attribute Constrained | Purchase Execution | 47.0% | 43.0% | +3.9 | 0.004 | no |
| Purchase Execution | Scenario Confirmation | 43.0% | 39.6% | +3.5 | 0.010 | no |
| Category Exploration | Comparison | 37.8% | 35.7% | +2.1 | 0.113 | no |
| Category Exploration | Scenario Confirmation | 37.8% | 39.6% | -1.8 | 0.183 | no |
Thirty-one of 36 pairs survive the correction at α = 0.05/36. The five that do not are neighbours in the middle of the table within four points of each other: Attribute Constrained against Purchase Execution, Category Exploration against Comparison and against Scenario Confirmation, Comparison against Scenario Confirmation, and Purchase Execution against Scenario Confirmation. The study never calls those out as differences. Every platform and category difference survives.
6. Discussion
Three things follow for anyone trying to predict or influence where products appear.
The levers are ordered. Platform, then intent, then category, then, far behind, wording. A brand that can only measure one thing should measure the engine; a brand that can only write for one thing should write for the stage. Phrasing is worth attention on Google AI Mode and Copilot and is a rounding error on Perplexity.
The engine-tagged signals are a vocabulary for the stages, not independent levers. Deal, urgency, purchase, and price signals describe the questions that budget and purchase shoppers ask; problem, brand, and comparison signals describe the questions that problem, validation, and comparison shoppers ask. A model that knows the stage does not need the signals.
Brand presence on the shelf is close to unpredictable from the question, and position on the shelf is predictable from reviews. The first means that being in the index for a category matters more than matching any particular query. The second means that, once on the shelf, review volume and rating are what move a product toward the front on ChatGPT and Google AI Mode, and that nothing measured moves it on Copilot.
7. Limitations Specific to This Chapter
- All models are observational. Odds ratios describe associations in the collected answers, not the effect of changing a question or a product.
- ChatGPT's served model is confounded with collection day for gpt-5-3 (all its answers come from May 5); the contrast between the mini model and gpt-5-5, which share collection days, is clean.
- The engine-tagged signals are absent for Electronics, so the six-category signal model excludes 3,599 answers.
- Rank-one models use only price, rating, and review count. Attributes of the product itself (brand, title match, availability) are not in the model, and a product's rank may depend on them.
- Two length features in the Study 1 logistic model (word count and the tagged query length) are collinear and their individual odds ratios are not interpretable; they are omitted from Table 6 and the gradient-boosting importances are reported instead.
- Brand-in-carousel models are fitted on carousels only, so they describe which carousel a brand gets, not whether a carousel appears.
Navigation. Previous: Chapter 3. Visibility by category · Next: Chapter 5. Ten surprises · AI Shopping Visibility Study 2026 (hub, abstract, and all chapters).
About the author. Vijaya Kumar Channalli is a serial SaaS founder and the founder of AEOsome (Tartu, Estonia), which helps eCommerce brands get their products recommended when shoppers ask AI what to buy. Read how we write, source and correct posts in our editorial policy.
Sources: AEOsome Research, AI Shopping Visibility Study 2026, chapter 4. Study 1: 8,520 ChatGPT answers, women's dresses, United States, February 28 to March 1, 2026. Study 2: 22,335 de-duplicated answers across ChatGPT, Google AI Mode, Microsoft Copilot, and Perplexity, seven categories, United States, May 5 to May 14, 2026. Hub: https://www.aeosome.com/blog/research/ai-shopping-visibility-study-2026/